Posts

Showing posts with the label GME

GME Daily Trend Analysis: Navigating Volatility Amidst Reversal Patterns.

Image
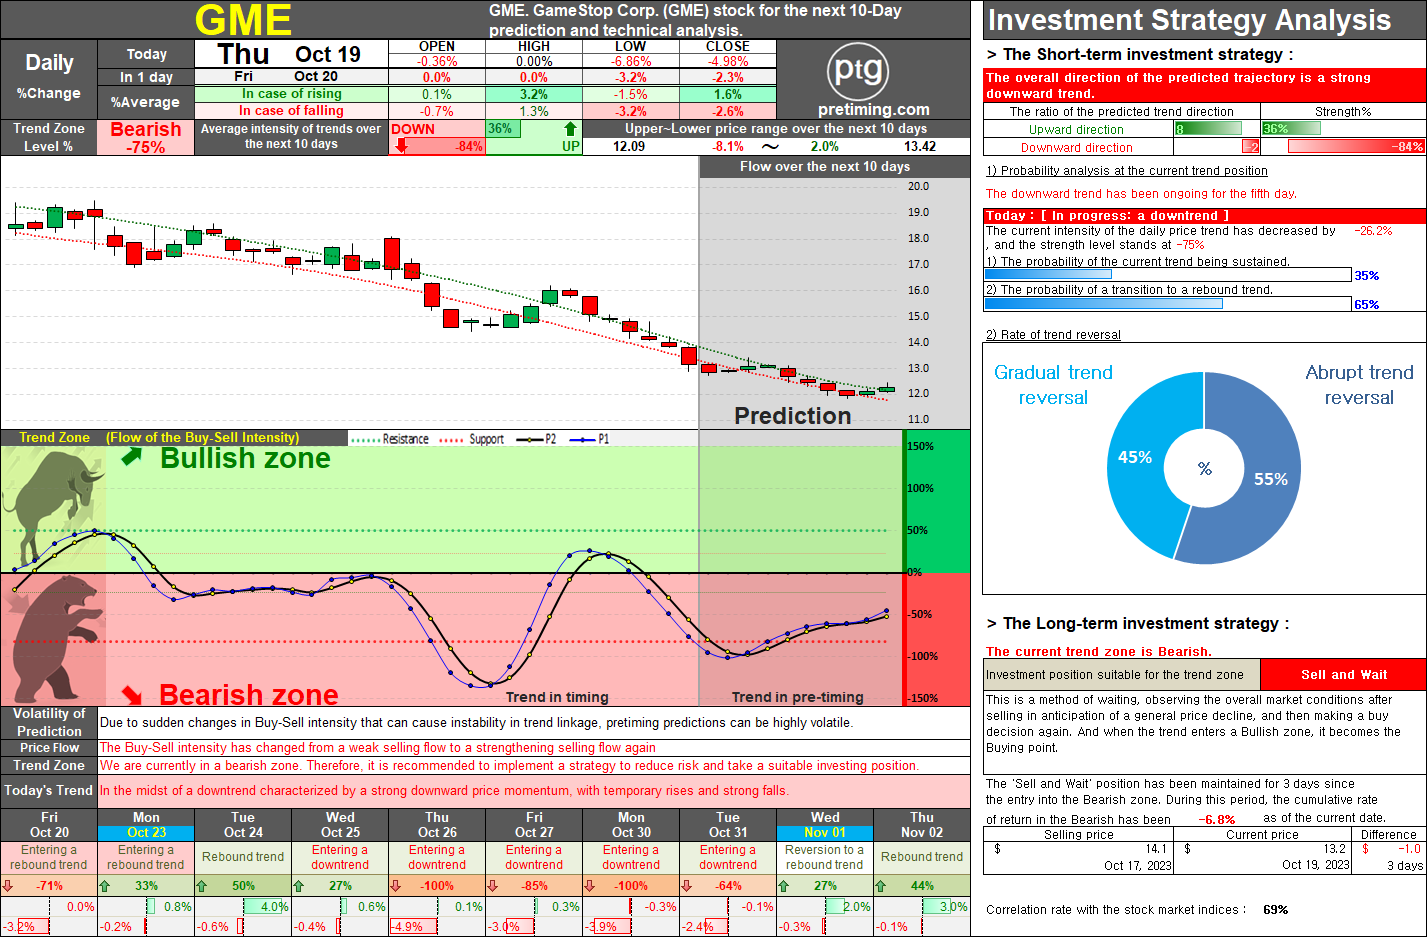
Introduction: Over the last four days, GME displayed a rebound trend within the bearish zone. However, on Wednesday, October 25th, the stock transitioned back into a downtrend, indicating intensified selling pressure. As anticipated, a prolonged downtrend seems likely, potentially deepening until early next week. Subsequently, a reversal to an upward trend is anticipated, possibly around mid-next week, as selling pressure weakens. Market Context: GME's trends are closely tied to the broader market, showing a 70% correlation. Vigilant market observation is crucial. The market is expected to shift to a rebound trend in 1-2 weeks, likely impacting GME positively during the same period. Conclusion: While short-term optimism exists for GME, expecting a sustained long-term uptrend requires further observation. Uncertainties persist, indicating a need for patience. Please note that these trends may be influenced by broader market dynamics. For further updates, stay tuned. Oct 25, 2023

GME: GameStop Daily Stock Analysis and Prediction Trend.

Image
October 19, 2023 Overview: GameStop entered the Bearish zone four days ago and has since displayed a downward trend. Currently near the psychological support level of the Bearish zone, it's anticipated to weaken in selling pressure and transition into a rebound trend over the next 1-2 days. However, this rebound might be limited due to overall weak buying intensity. A modest and temporary uptick is likely. The mid-next week might witness a brief rebound, followed by another downward trend. Long-Term Outlook: The sustained weakness in buying momentum suggests significant downside risk. Prospective gains remain low, and continual retesting of lows is possible. A more strategic entry point for long-term investment might be prudent, given the potential for a prolonged Bearish zone trend. Market Correlation: GME demonstrates a 69% correlation with the broader market, indicating similarities in upward and downward movements. The overall market is predicted to start a rebound trend mid

Popular Posts

NASDAQ. The current analysis suggests that the NASDAQ index is currently in a bearish trend, with a recommendation to sell and observe..

= Pretiming Premium =

DowJones. The current analysis suggests that the Dow Jones index is in a bearish trend, recommending a strategy of selling and observing for long-term investment.

SOXL. Navigating the Bearish Zone: Strategies for Short-Term Trading in a Volatile Market.

TSLA. On May 15, 2024, TSLA stock closed at 174.0, marking a decrease of 2.01%. The current trend zone is Bearish, suggesting a suitable investment position of Sell and Observe.

NASDAQ. The document provides a detailed market analysis suggesting a bullish trend for the NASDAQ index, recommending a 'Buy and Hold' strategy for both long-term and short-term investments.

S&P500. Comprehensive Analysis and Strategies for S&P 500 Investment.

MARA. The current trend appears to be 'Downtrend and The trend is progressing in the Bearish zone. The characteristics of the trend are: Continuous decline (standby) - (High selling pressure).

SMTC. Investors should take note of the bearish trend in SMTC stock, currently in a 'Sell and Observe' phase for the long-term strategy.

AMC Entertainment Holdings Daily Stock Analysis: Potential Reversal in Trend.