Posts

Showing posts from November 28, 2023

US Stock Market Average Index (USMAI) Daily Trend Analysis.

Image
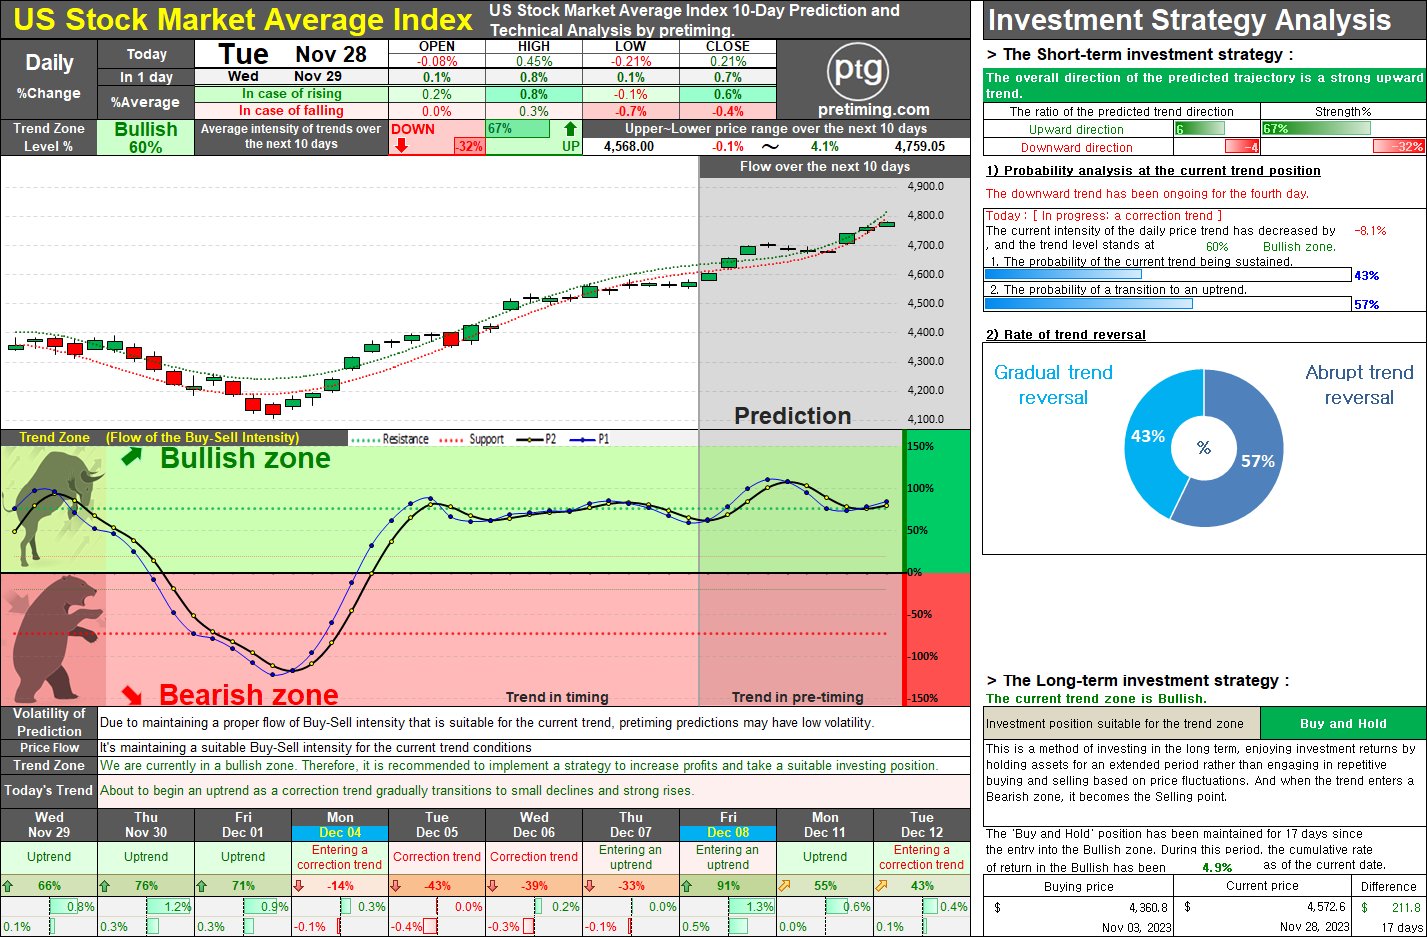
Executive Summary: The US Stock Market Average Index (USMAI) daily trend is based on a weighted average of the Dow Jones, Nasdaq, and S&P 500 indices, with the S&P 500 as its foundation. Serving as a comprehensive benchmark for the overall trend in the US stock market, the USMAI daily trend entered the Bullish zone 17 days ago, displaying both upward and corrective trend flows. It has accumulated a 4.9% increase since entering the Bullish zone. Recent upward momentum has been constrained, with a correction trend showing fluctuations. However, as of November 28, there are indications of a shift from the correction trend to an upward trend, expected to continue until at least this Friday, November 29. Subsequently, in the following week, a correction trend with weakened buying strength is anticipated, leading to limited fluctuations between upward and downward trends. Market Analysis: Given the ongoing trend in the Bullish zone, overall potential buying strength remains strong,

GDXU, MICROSECTORS GOLD MINERS 3X LEVERAGED ETN Daily Price Analysis..

Image
Summary: The daily price of GDXU, a 3x leveraged ETN tracking the performance of gold miners, entered the Bullish zone five days ago, signaling a robust upward trend. While there has been a temporary weakening of buying interest in the last 2-3 days, a correction trend seems to be in progress. However, the daily trend is once again showing signs of turning upward, indicating a resumption of the strong bullish momentum. Outlook: This current trend is anticipated to persist in the short term, with a continuous increase in highs. The stability observed in the Bullish zone suggests a consistent flow, and even in the face of correction trends, a brief downturn is expected before resuming the overall upward trend. Given its 69% correlation with the Russell 2000 index, it is advisable to consider the influence of the broader U.S. market trends when making investment decisions. The consistent rise in highs implies a positive outlook, and navigating through short-term corrections is expected to

Popular Posts

S&P500. Anticipating the Rebound: Strategic Analysis for S&P 500's Trend Reversal.

NASDAQ.Technical Analysis and Investment Strategy for NASDAQ: Bearish Zone Insights and Short-Term Predictions.

TQQQ. Stock Update: Bullish Trends and Long-Term Investment Tips.

= Pretiming Premium =

S&P500. The S&P 500 is currently in an uptrend within the Bullish zone, but weakening buying momentum indicates a potential shift to a correction phase. Over the next 1-2 weeks, increased selling pressure is expected to deepen this downward movement.

TQQQ. Summary of Technical Analysis and Investment Strategy for TQQQ Stock (July 22, 2024)

SOXL Stock: A Comprehensive Investment Analysis for July 2024

TSLA. Tesla stock for the next 10 week prediction and technical analysis

TSLA. Current Weekly Trend: Bearish, likely to change to bullish soon.

MARA. The current trend appears to be 'Downtrend and The trend is progressing in the Bearish zone. The characteristics of the trend are: Continuous decline (standby) - (High selling pressure).