Posts

Showing posts with the label NASDAQ

NASDAQ. Market Analysis and Outlook: Navigating Trends in January and February

Image
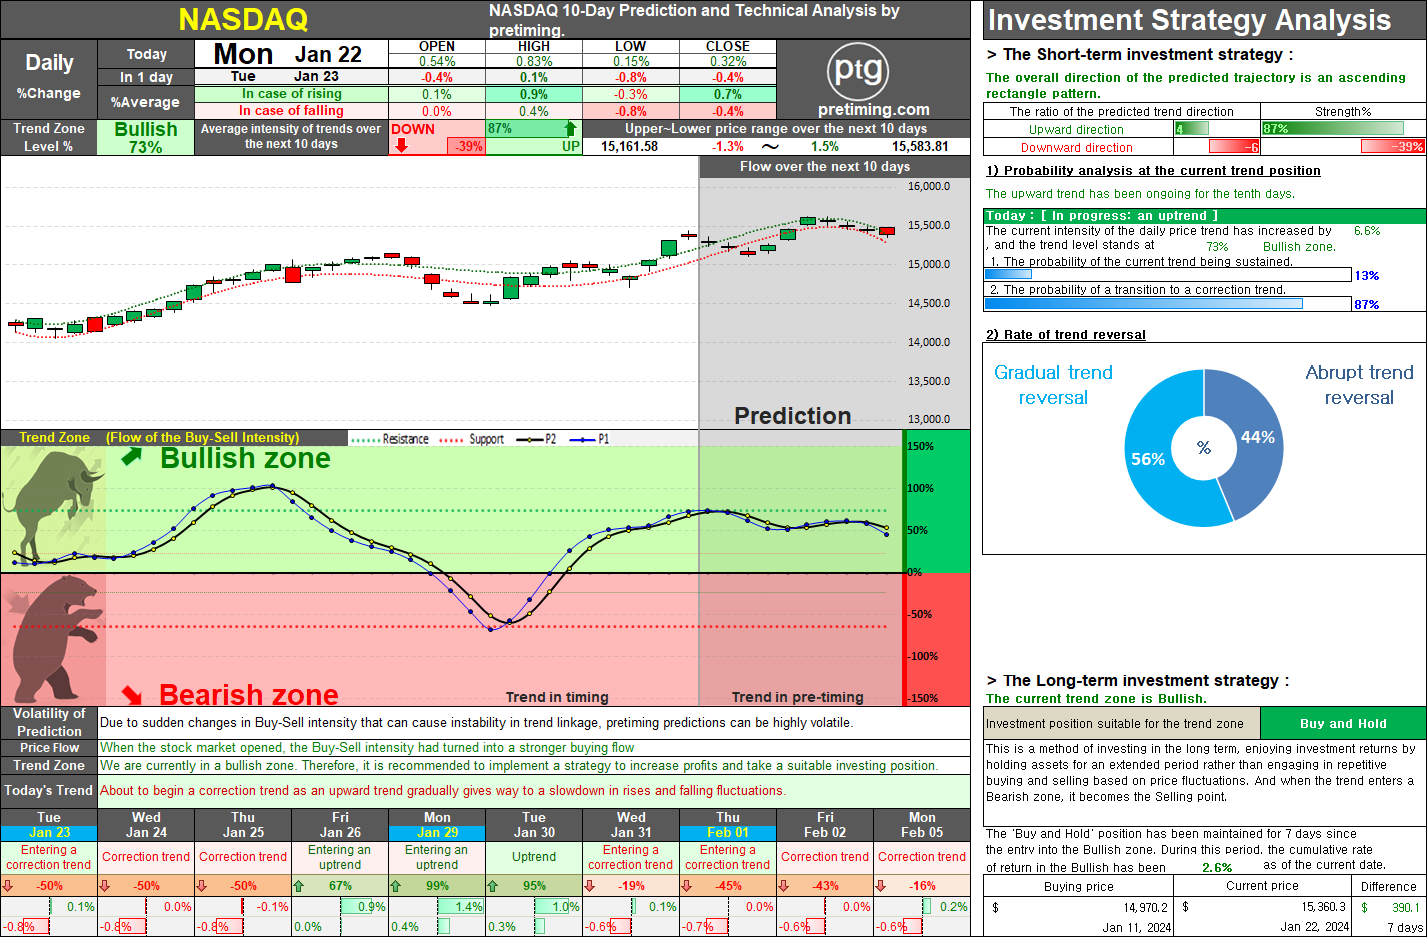
As of January 22nd, Monday, the NASDAQ index closed with a 0.32% increase, signaling a positive start to the week. The current daily trend remains in the Bullish zone, reflecting a continued upward trajectory. However, we are now approaching a phase where buying momentum is gradually diminishing, indicating an imminent correction trend. This evolving trend is expected to persist until tomorrow, after which a gradual shift towards a correction trend is anticipated. The projected duration of this correction trend is estimated to be around 4 days. We foresee a potential return to an upward trend by the end of this week or early next week, signaling a resurgence in buying strength. Therefore, it seems that the opportune moment to re-enter the market with stronger buying momentum will be around that time. Looking ahead, a generally favorable ebb and flow in market movements are expected until the end of January. However, as we transition into February, there are signs of a weakening buying

Market Insights: Evaluating Nasdaq's Unexpected Bullish Turn and Potential Correction.

Image
The Nasdaq index has experienced a strong upward trend and a rebound trajectory this week, leading to the current state where the weekly trend has entered the Bullish zone. It is anticipated that the weekly trend will continue within the Bullish zone for the foreseeable future. Moreover, the previously consistent prediction of a downward trend entering from mid-November, characterized by a weakening buying strength and strengthening selling pressure, is expected to undergo some modifications. While it is challenging to determine whether this week's trend is a temporary strong upward movement, based on the volatility observed this week, there is a possibility that the gradual trend with mild buying strength may persist for another 1-2 weeks. However, as it appears to be a point where a peak is forming and the trend has entered the Bullish zone instead of the predicted downward trend, a transition to a correction trend is anticipated. If next week shows a marginal or limited upward m

Popular Posts

NASDAQ. The current analysis suggests that the NASDAQ index is currently in a bearish trend, with a recommendation to sell and observe..

TSLA. On May 15, 2024, TSLA stock closed at 174.0, marking a decrease of 2.01%. The current trend zone is Bearish, suggesting a suitable investment position of Sell and Observe.

NASDAQ. The document provides a detailed market analysis suggesting a bullish trend for the NASDAQ index, recommending a 'Buy and Hold' strategy for both long-term and short-term investments.

DowJones. The current analysis suggests that the Dow Jones index is in a bearish trend, recommending a strategy of selling and observing for long-term investment.

SOXL. Navigating the Bearish Zone: Strategies for Short-Term Trading in a Volatile Market.

= Pretiming Premium =

AMC Entertainment Holdings Daily Stock Analysis: Potential Reversal in Trend.

S&P500. Comprehensive Analysis and Strategies for S&P 500 Investment.

SMTC. Investors should take note of the bearish trend in SMTC stock, currently in a 'Sell and Observe' phase for the long-term strategy.

MARA. The current trend appears to be 'Downtrend and The trend is progressing in the Bearish zone. The characteristics of the trend are: Continuous decline (standby) - (High selling pressure).