Posts

Showing posts with the label TQQQ

TQQQ. Trek: Navigating Bullish Waves - Long-Term Hold, Short-Term Surges with Precision Predictions.

Image
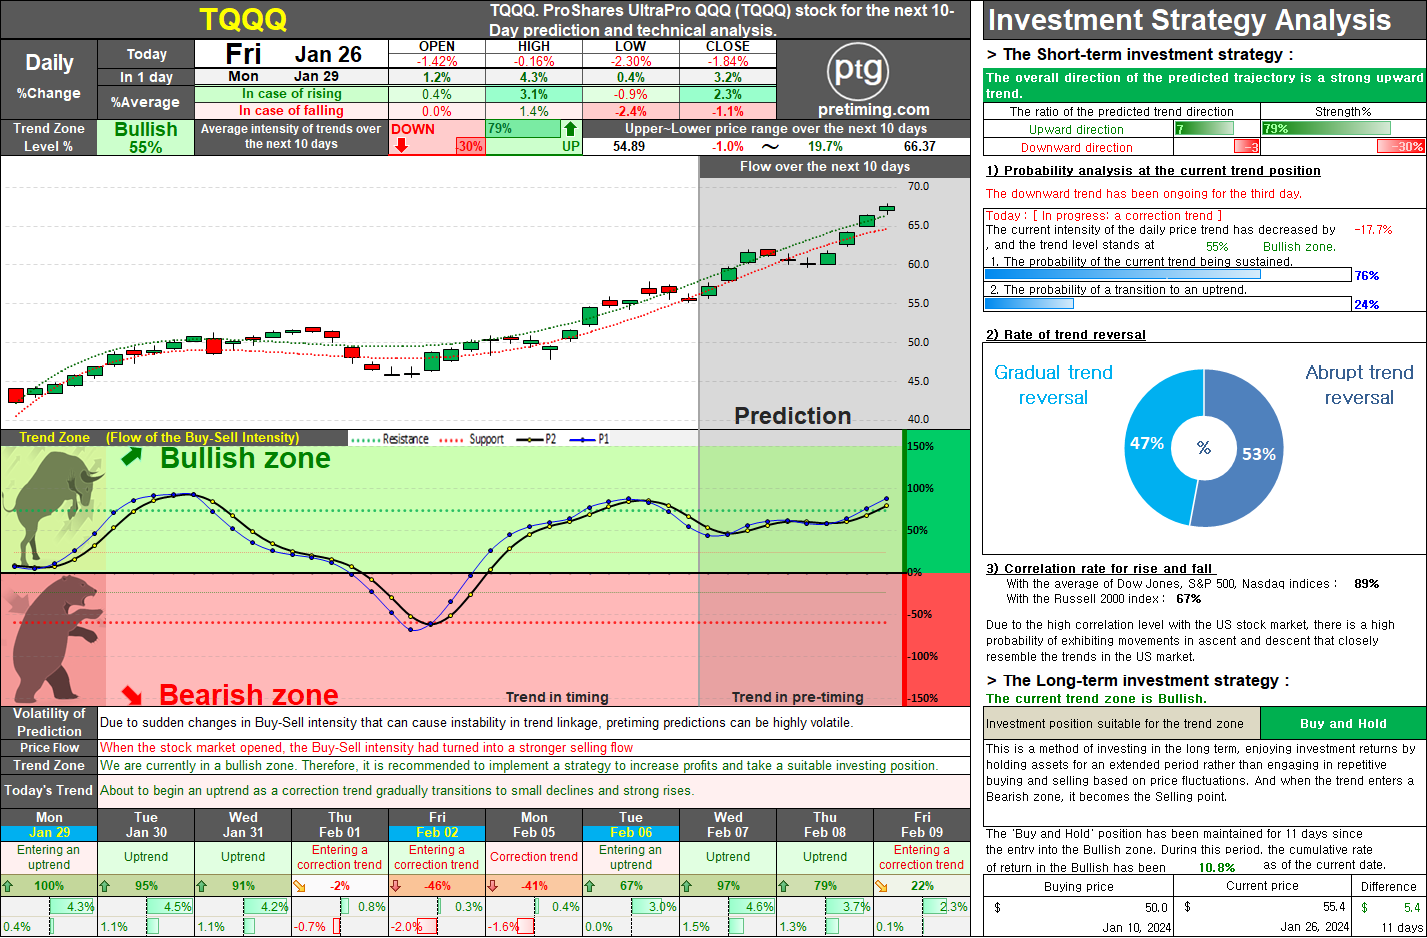
Jan 26, 2024       TQQQ stock closing price 55.4 -1.84%             ◆ [Long-term strategy] The current trend zone is Bullish. and Investment position suitable for the trend zone is Buy and Hold.         The trend within a Bullish zone is divided into an 'Uptrend' in the upward direction and a 'Correction Trend' in the downward direction. In the Uptrend, there is a strong upward flow with occasional downward movements, while in the Correction Trend, there is a fluctuating flow involving limited or temporary downward movements and upward fluctuations. Investing in this zone is associated with high expected returns and a low risk of decline.         In a Bullish zone, the potential for strong buying pressure is maintained, leading to a robust upward trend and a relatively mild correction trend. When viewed through a medium to long-term investment approach, if the trend continues to move in th

TQQQ: Weekly Forecast Navigating Near-Term Challenges for Long-Term Gains

Image
The weekly trend of TQQQ entered the Bullish zone five weeks ago, and a favorable upward trend is ongoing, consistently pushing the highs higher. Based on the direction of the trend, it has maintained an upward flow for the seventh consecutive week. In the short term, it is expected that from next week onwards, the buying momentum will gradually weaken, indicating a potential entry into a correction trend. This trend is expected to transition to an overall correction trend by early to mid-January, about two weeks later. Subsequently, a trend indicating a return to an upward trajectory is anticipated. In the short term, the flow is expected to fluctuate around the resistance level of $50, serving as a short-term peak. Over the next few weeks, buying strength is expected to be weak, and selling pressure may temporarily intensify. This forecast suggests that there will be periods of weaker buying and temporary strengthening of selling pressure in the coming weeks. Dec 11, 2023 ◆ Closed pr

Popular Posts

NASDAQ. The current analysis suggests that the NASDAQ index is currently in a bearish trend, with a recommendation to sell and observe..

TSLA. On May 15, 2024, TSLA stock closed at 174.0, marking a decrease of 2.01%. The current trend zone is Bearish, suggesting a suitable investment position of Sell and Observe.

NASDAQ. The document provides a detailed market analysis suggesting a bullish trend for the NASDAQ index, recommending a 'Buy and Hold' strategy for both long-term and short-term investments.

= Pretiming Premium =

DowJones. The current analysis suggests that the Dow Jones index is in a bearish trend, recommending a strategy of selling and observing for long-term investment.

SOXL. Navigating the Bearish Zone: Strategies for Short-Term Trading in a Volatile Market.

AMC Entertainment Holdings Daily Stock Analysis: Potential Reversal in Trend.

S&P500. Comprehensive Analysis and Strategies for S&P 500 Investment.

MARA. The current trend appears to be 'Downtrend and The trend is progressing in the Bearish zone. The characteristics of the trend are: Continuous decline (standby) - (High selling pressure).

SMTC. Investors should take note of the bearish trend in SMTC stock, currently in a 'Sell and Observe' phase for the long-term strategy.