Posts

Bullish Momentum in SPY: Limited Gains Expected Amidst Overheated Uptrend, Potential Bearish zone Turn Ahead Two weeks from now.

Image
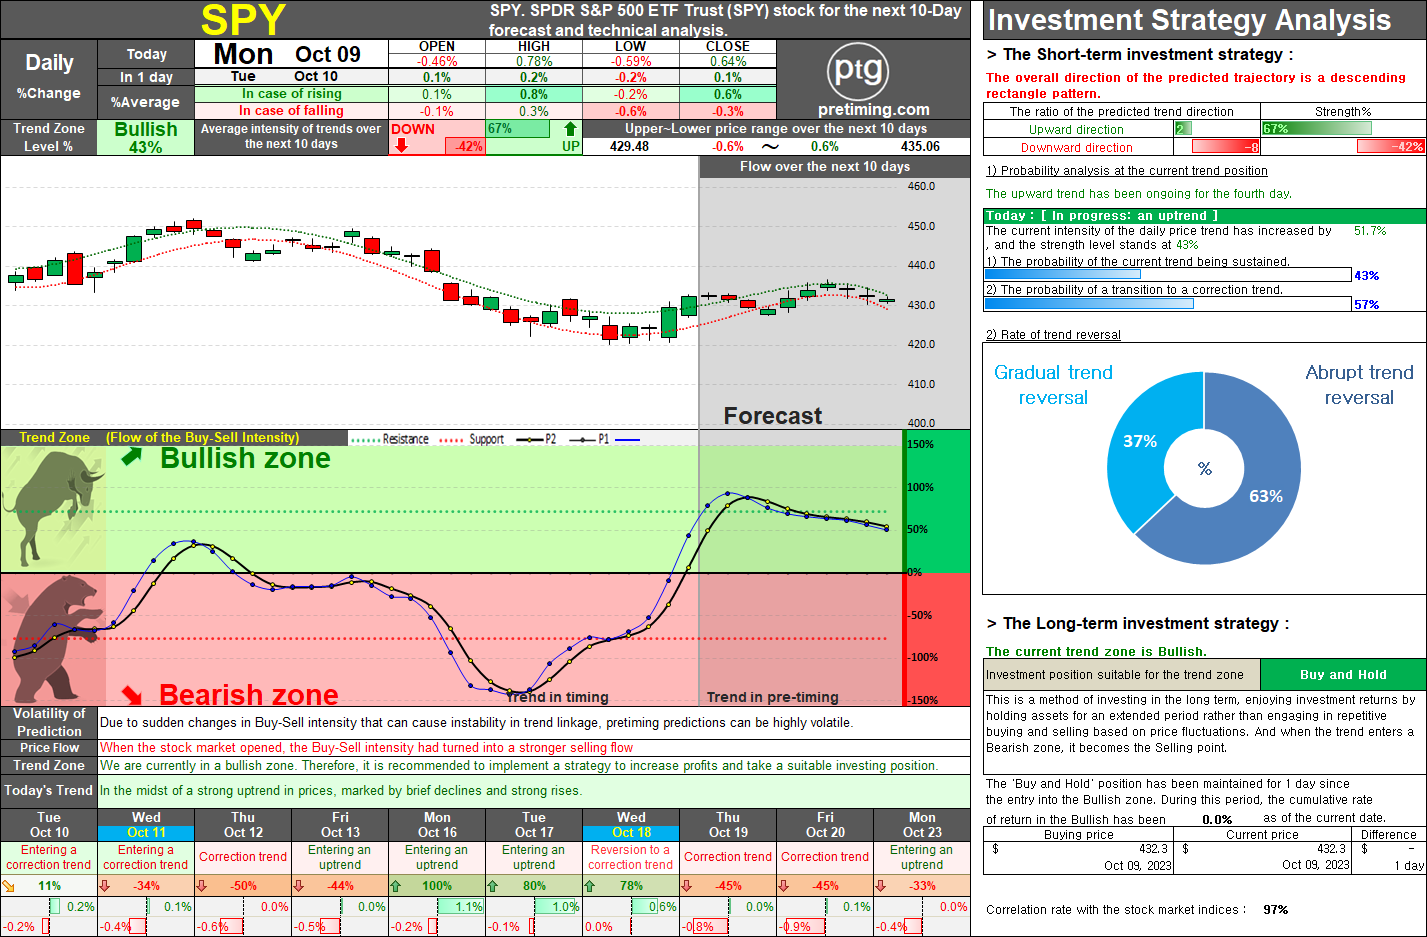
  The daily chart of SPY has entered the Bullish zone, marking the beginning of a strong uptrend. However, in the short term, we anticipate limited gains and brief correction periods due to the overheated upward movement. It is expected to continue this way until the end of this week or early next week, after which a robust upward trend is anticipated. This strong upward movement and minor corrections within the Bullish zone are likely to persist until next week, but afterward, there is a high probability of entering the Bearish zone, increasing the risk of a decline. Oct 09, 2023 ◆ Closed price 432.29 0.64%     ◆ Appropriate Investment Position: Bullish-Buy [Long-term strategy] ◆ Today's stock price Buy-Sell intensity analysis The current trend appears to be 'Uptrend'. The OPEN-price started with a stronger decline rate than the current trend and The HIGH and LOW prices are showing an appropriate HIGH-price to the current trend and a stronger LOW-price Finally, the CL

Bullish Momentum: NASDAQ Index Shifts Gears, Predicting a Favorable Upward Trend Ahead.

Image
The NASDAQ index, which started with a strong decline from the Bearish zone two days ago, showed a weak buying intensity initially. However, as buying strength gradually increased, it ended the day with a very strong upward trend, entering the Bullish zone. This change in zone, driven by this flow, suddenly altered the overall direction of the predicted trend. Considering the predicted trend of the NASDAQ index to continue in the Bullish zone for the next two weeks, it appears that the downside risk will be limited. A favorable upward trend is expected to persist in the near future. Oct 09, 2023 ◆ Closed price 13,484.24 0.39%     ◆ Appropriate Investment Position: Bullish-Buy [Long-term strategy] ◆ Today's Buy-Sell intensity analysis The current trend appears to be 'Uptrend'. The OPEN-price started with a stronger decline rate than the current trend and The HIGH and LOW prices are showing a weaker HIGH-price and a stronger LOW-price Finally, the CLOSE-price closed with

Popular Posts

NASDAQ. The current analysis suggests that the NASDAQ index is currently in a bearish trend, with a recommendation to sell and observe..

TSLA. On May 15, 2024, TSLA stock closed at 174.0, marking a decrease of 2.01%. The current trend zone is Bearish, suggesting a suitable investment position of Sell and Observe.

NASDAQ. The document provides a detailed market analysis suggesting a bullish trend for the NASDAQ index, recommending a 'Buy and Hold' strategy for both long-term and short-term investments.

DowJones. The current analysis suggests that the Dow Jones index is in a bearish trend, recommending a strategy of selling and observing for long-term investment.

SOXL. Navigating the Bearish Zone: Strategies for Short-Term Trading in a Volatile Market.

= Pretiming Premium =

AMC Entertainment Holdings Daily Stock Analysis: Potential Reversal in Trend.

S&P500. Comprehensive Analysis and Strategies for S&P 500 Investment.

SMTC. Investors should take note of the bearish trend in SMTC stock, currently in a 'Sell and Observe' phase for the long-term strategy.

MARA. The current trend appears to be 'Downtrend and The trend is progressing in the Bearish zone. The characteristics of the trend are: Continuous decline (standby) - (High selling pressure).