Posts

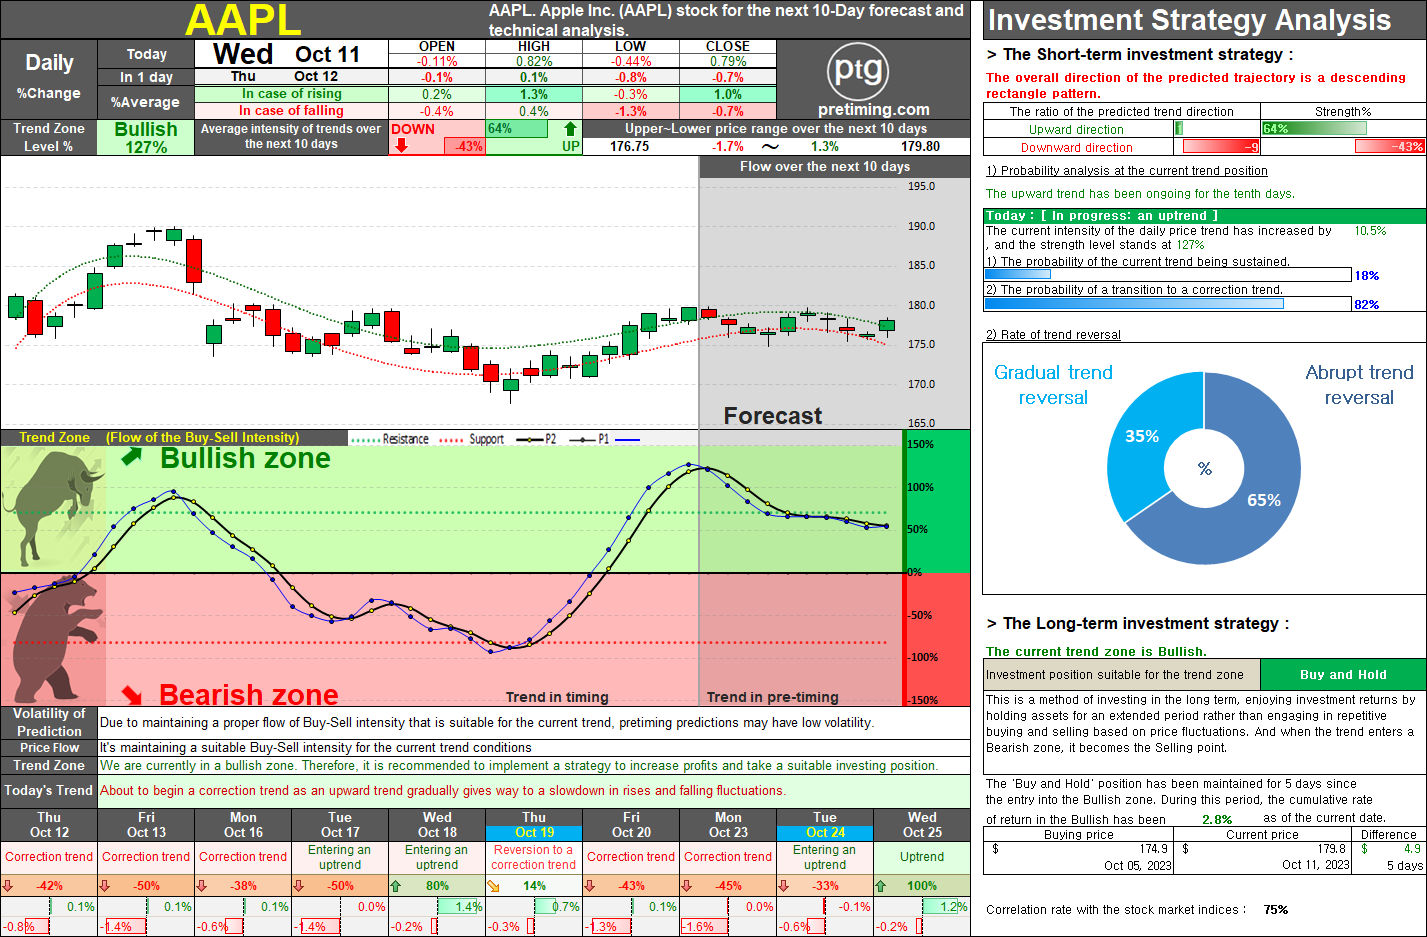
NVDA Stock Forecast: Analyzing Trends with a Focus on US Stock Market Correlation.

Image
The daily stock price of NVDA has been on an upward trend for the past 6 days; however, it entered a correction trend starting from October 12th. It appears that a correction trend will continue tomorrow, and there will be fluctuations in the overall trend for a while. In the short term, there will be limited fluctuations between rises and falls until early next week. Afterward, there might be a brief upward trend, followed by a continuation of the correction trend. The overall trend is expected to be within a trading range. It shows about 72% similarity with the movement of the US stock market. Therefore, although the trend direction and timing might differ based on the index movement, it is anticipated that the US stock market will progress similarly. Hence, significant changes are not expected. Oct 12, 2023 ◆ Closed price 469.45 0.30%     ◆ Appropriate Investment Position: Bullish-Buy [Long-term strategy] ◆ Today's stock price Buy-Sell intensity analysis The current trend appe

AAPL Stock Enters Correction Phase: Risk Management Needed

Image
The daily chart of AAPL currently indicates a potential shift from the uptrend to a corrective trend, with Thursday, October 12th, appearing to mark the entry point into this correction phase. This corrective pattern is expected to unfold from next Monday to Tuesday, followed by a brief resumption of the upward trend, before continuing the corrective movement. A broader consolidation pattern is anticipated in the near term. Following this consolidation, as we approach mid-October, there are signs of a gradual weakening in the trend, potentially leading the stock into the Bearish zone. Entering the Bearish zone implies a primary downtrend, where the stock experiences a temporary rebound within a strong bearish flow. Considering the overall intensity of this downward movement, the stock is likely to be firmly within a significant bearish trend. Taking these factors into account, it is anticipated that a general bearish trend will prevail from mid to late October. Given these market dynam

Popular Posts

SMTC. Investors should take note of the bearish trend in SMTC stock, currently in a 'Sell and Observe' phase for the long-term strategy.

= Pretiming Premium =

DowJones. The current analysis suggests that the Dow Jones index is in a bearish trend, recommending a strategy of selling and observing for long-term investment.

NASDAQ. The current analysis suggests that the NASDAQ index is currently in a bearish trend, with a recommendation to sell and observe.

AAPL. The weekly trend for AAPL appears to be in a bearish zone, with a downward trajectory underway. However, there are indications of a short-term entry into a rebound trend.

SOXL. Navigating the Bearish Zone: Strategies for Short-Term Trading in a Volatile Market.

NASDAQ. Navigating Market Dynamics: Analyzing Bearish Trends and Strategic Rebound Approaches

MARA. The current trend appears to be 'Downtrend and The trend is progressing in the Bearish zone. The characteristics of the trend are: Continuous decline (standby) - (High selling pressure).

S&P500. Comprehensive Analysis and Strategies for S&P 500 Investment.

LABU. Short-Term Strategy : Timing Selling and Buying Amidst Bearish Trends