Posts

GOOGL Stock Analysis: Navigating the Current Trend and Anticipating Key Market Shifts.

Image
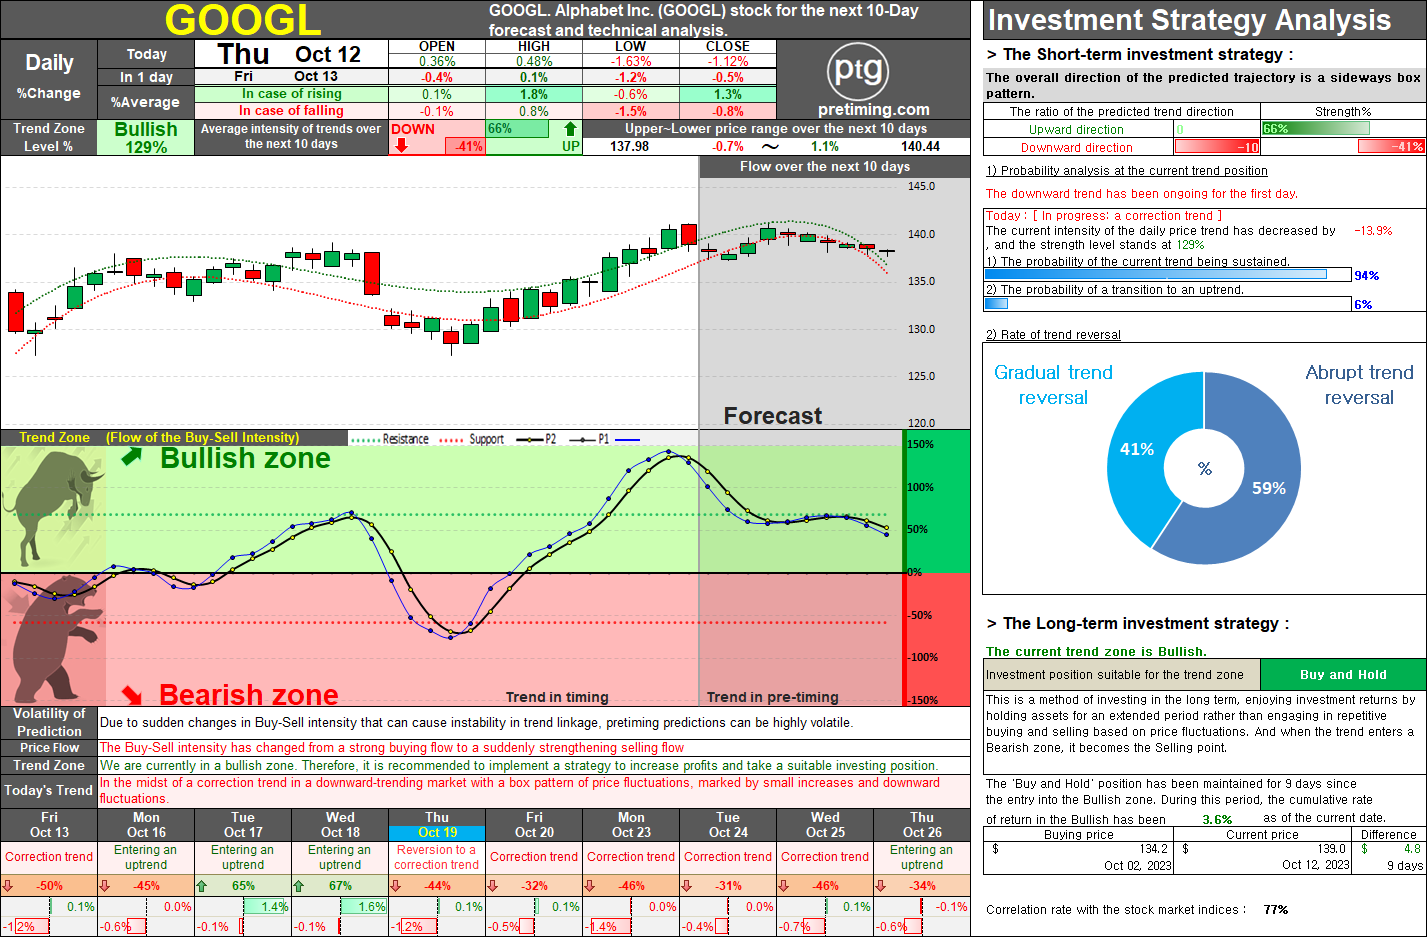
The daily price of GOOGL has transitioned into a corrective trend since October 12th, interrupting the 9-day upward momentum. Considering recent market fluctuations, today's decline indicates a relatively strong downward movement with increased selling pressure. The overall trend is expected to continue in the corrective mode, with a minor attempt to enter an uptrend early next week. However, a complete shift to an upward trend seems unlikely, remaining within the boundaries of the corrective trend. By mid-October, the trend is likely to weaken further, possibly entering the Bearish zone with increasing downward pressure. The similarity with the US market index is at a high level of 77%, but the prediction may vary slightly based on overall market conditions. Currently positioned at 129% within the Bullish zone, there is some time before entering the Bearish zone, allowing for a gradual correction and a potential return to an uptrend. However, as we approach next week, reaching aro

Understanding META's Trends: Navigating the Shifts in the Stock Market.

Image
  The daily price of META has been in the Bullish zone for 11 consecutive days. After a recent uptrend, it shifted to a correction trend starting from October 12th, indicating a continued correction trend in the near future. Although there might be signs of a return to the uptrend next week, the likelihood of a complete reversal to the bullish trend seems low, with an overall continuation of the correction trend anticipated. As we approach mid to late October, the overall trend is expected to weaken further, entering the Bearish zone and giving rise to a downtrend. In the short term, the expected returns appear modest. Oct 12, 2023 ◆ Closed price 324.16 -1.12%     ◆ Appropriate Investment Position: Bullish-Buy [Long-term strategy] ◆ Today's stock price Buy-Sell intensity analysis The current trend appears to be 'Correction trend'. The OPEN-price started with a stronger upward rate than the current trend and The HIGH and LOW prices are showing a weaker HIGH-price and an

Popular Posts

NASDAQ. The current analysis suggests that the NASDAQ index is currently in a bearish trend, with a recommendation to sell and observe..

TSLA. On May 15, 2024, TSLA stock closed at 174.0, marking a decrease of 2.01%. The current trend zone is Bearish, suggesting a suitable investment position of Sell and Observe.

NASDAQ. The document provides a detailed market analysis suggesting a bullish trend for the NASDAQ index, recommending a 'Buy and Hold' strategy for both long-term and short-term investments.

DowJones. The current analysis suggests that the Dow Jones index is in a bearish trend, recommending a strategy of selling and observing for long-term investment.

SOXL. Navigating the Bearish Zone: Strategies for Short-Term Trading in a Volatile Market.

= Pretiming Premium =

AMC Entertainment Holdings Daily Stock Analysis: Potential Reversal in Trend.

S&P500. Comprehensive Analysis and Strategies for S&P 500 Investment.

SMTC. Investors should take note of the bearish trend in SMTC stock, currently in a 'Sell and Observe' phase for the long-term strategy.

MARA. The current trend appears to be 'Downtrend and The trend is progressing in the Bearish zone. The characteristics of the trend are: Continuous decline (standby) - (High selling pressure).