Posts

JPM Weekly Trend: Short-Term Rebound or Prolonged Downtrend Ahead?

Image
  The weekly trend of JPM has been in the Bearish zone for the past 7 weeks. After entering the Bearish zone, a downtrend ensued, but in the past few weeks, the selling pressure weakened, showing fluctuations. Starting last week, the trend shifted to an uptrend, indicating a rising direction for the second consecutive week. This upward trend is expected to continue until next week. However, from two weeks onwards, the buying momentum is anticipated to weaken, leading to a reversal back into the downtrend. Although there might be a temporary entry into the Bullish zone, it is unlikely to sustain. Considering the 74% similarity with the US market, JPM's weekly trend is expected to have a short-lived uptrend, especially given the likelihood of the US market entering a downtrend next week. Overall, it is advisable to consider this as a short-term rebound peak. If the uptrend reverses, a prolonged downtrend is expected to follow. Oct 09, 2023 ◆ Closed price 148.00 2.00%     ◆ Appropriat

AMD Stock: Continued Downtrend Expected After Short-Term Rebound

Image
The AMD weekly trend has been in a Bearish zone for the past 13 weeks. Although there was a recent uptrend over the last 3 weeks, this week marks a point where the buying momentum from the uptrend is gradually weakening, and selling pressure is strengthening, indicating a re-entry into a downtrend. It is anticipated that a similar pattern will continue into the next week, with a potentially larger downward movement. Following this trend, it is expected that a downtrend will persist over the next 3 to 4 weeks. A reversal into an uptrend is projected around mid-November. It is worth noting that this prediction is subject to change based on the direction of the US stock market, given the 74% similarity between AMD's trends and the broader US market. Even if a reversal to an uptrend occurs in November, the overall trend is likely to remain within the Bearish zone, limiting potential profits. Any strong upward movement indicating a significant uptrend may require a considerable waiting

Popular Posts

NASDAQ. The current analysis suggests that the NASDAQ index is currently in a bearish trend, with a recommendation to sell and observe..

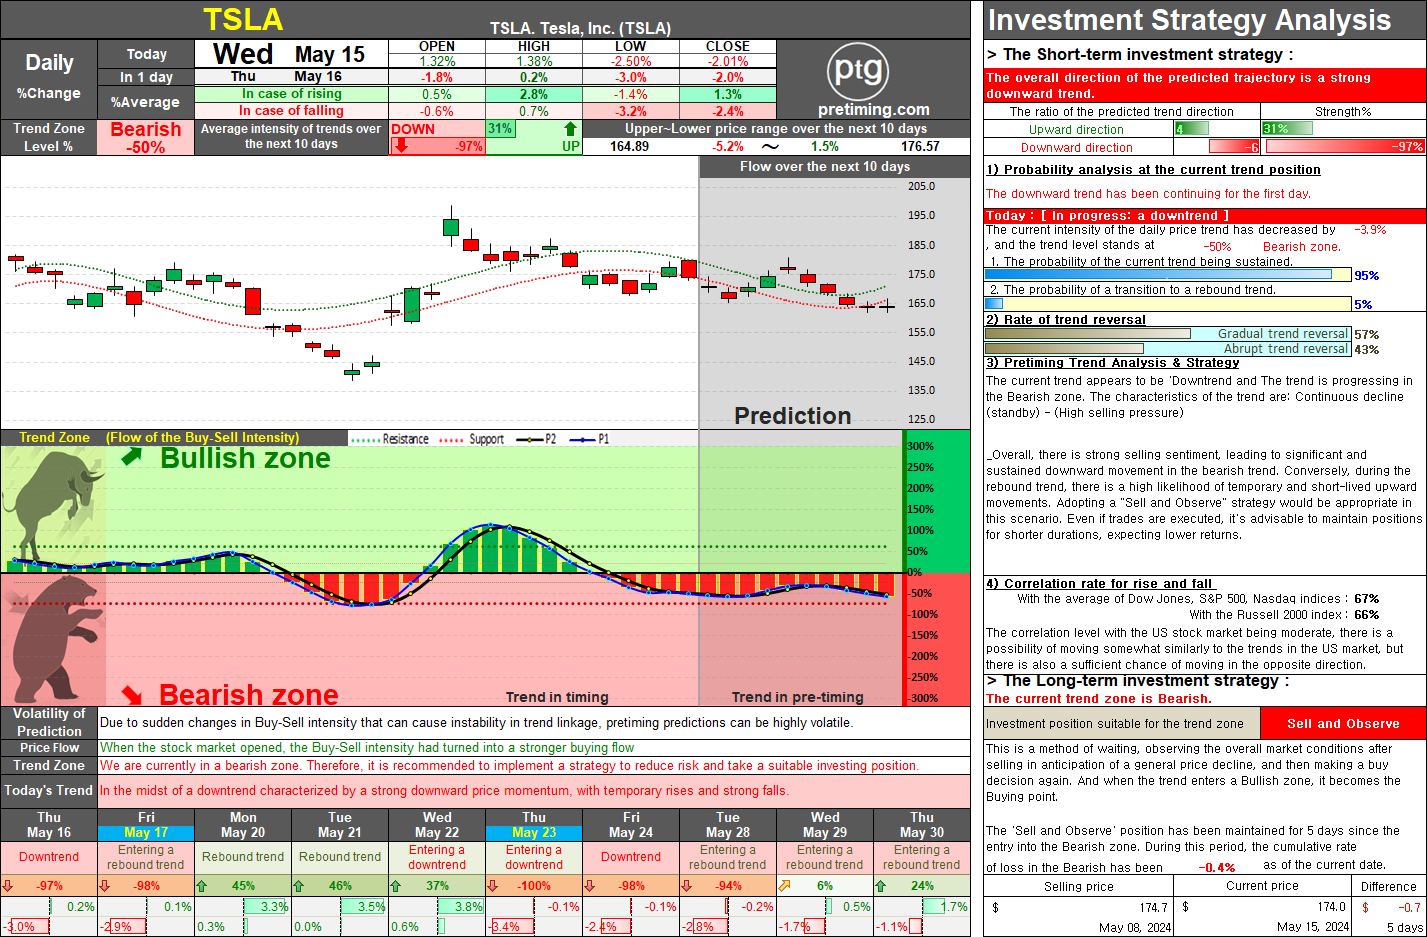
TSLA. On May 15, 2024, TSLA stock closed at 174.0, marking a decrease of 2.01%. The current trend zone is Bearish, suggesting a suitable investment position of Sell and Observe.

NASDAQ. The document provides a detailed market analysis suggesting a bullish trend for the NASDAQ index, recommending a 'Buy and Hold' strategy for both long-term and short-term investments.

= Pretiming Premium =

DowJones. The current analysis suggests that the Dow Jones index is in a bearish trend, recommending a strategy of selling and observing for long-term investment.

SOXL. Navigating the Bearish Zone: Strategies for Short-Term Trading in a Volatile Market.

AMC Entertainment Holdings Daily Stock Analysis: Potential Reversal in Trend.

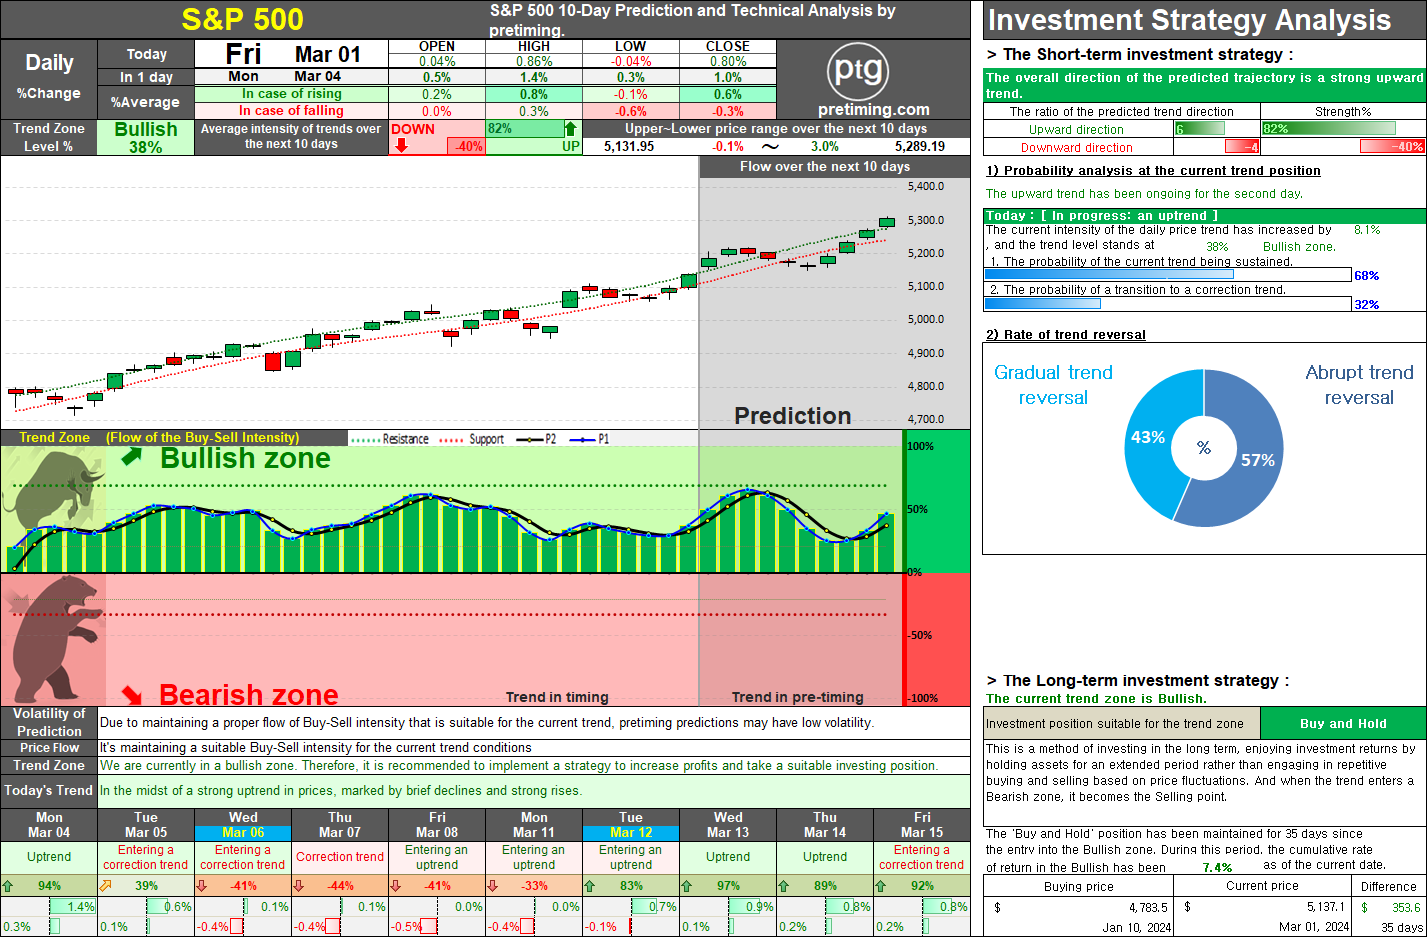
S&P500. Comprehensive Analysis and Strategies for S&P 500 Investment.

SMTC. Investors should take note of the bearish trend in SMTC stock, currently in a 'Sell and Observe' phase for the long-term strategy.

MARA. The current trend appears to be 'Downtrend and The trend is progressing in the Bearish zone. The characteristics of the trend are: Continuous decline (standby) - (High selling pressure).