Posts

Bilibili Inc. (BILI) Daily Trend Analysis: Optimistic Long-term Prospects in a Bullish Zone.

Image
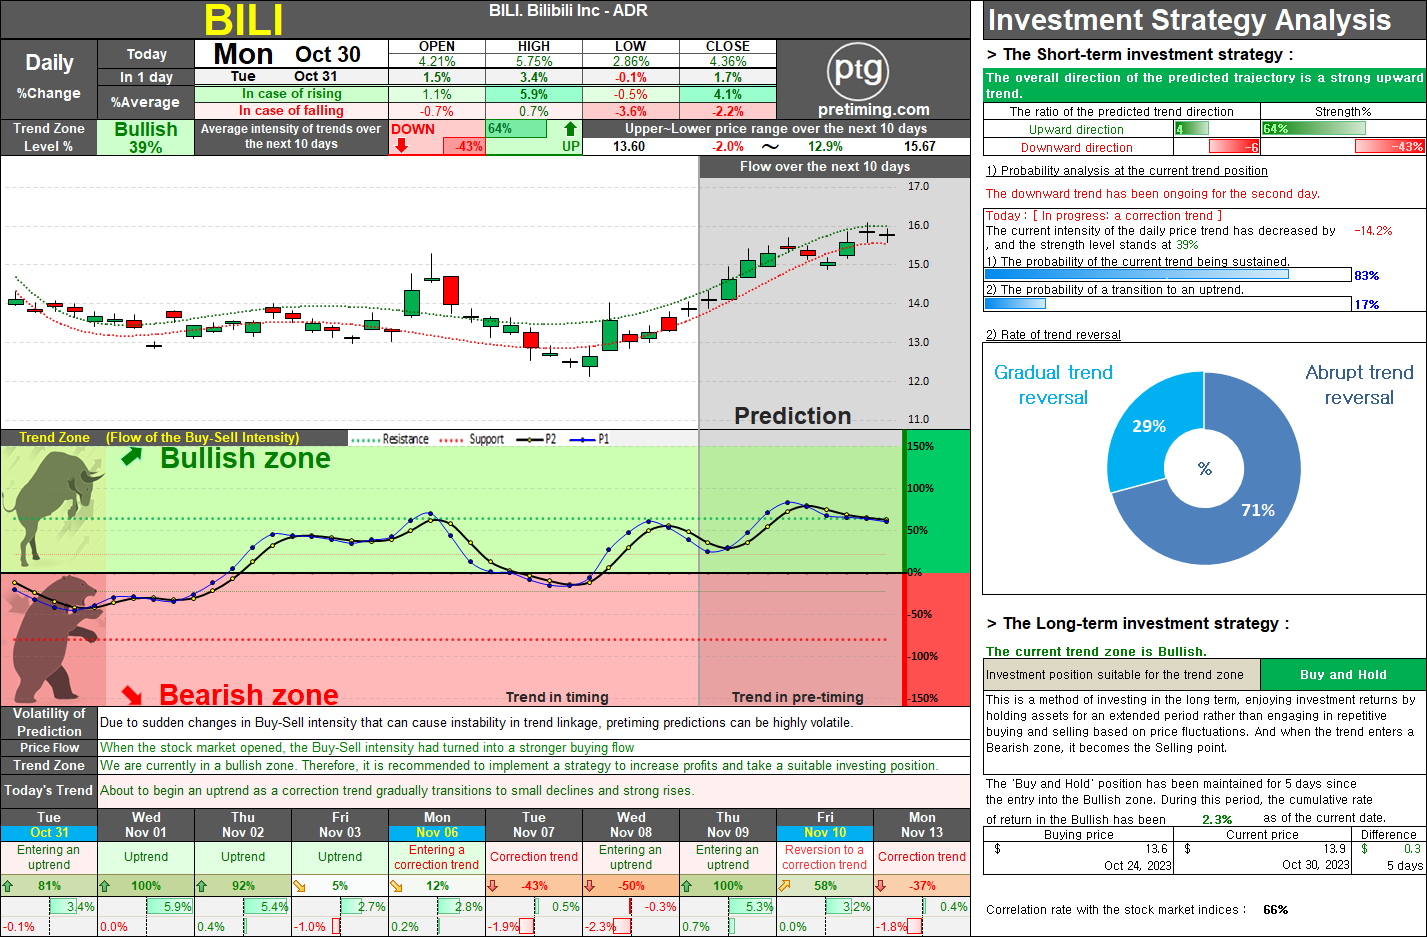
The daily trend analysis for Bilibili Inc. (BILI) shows that it entered the Bullish zone five days ago, indicating a pattern of upward and corrective movements. Looking at this from a long-term perspective, the ongoing trend within the Bullish zone suggests a consistent upward trajectory. If the trend were to enter the Bearish zone, it might signify the beginning of a sustained downward movement, suggesting a conservative approach is appropriate. In the short term, there is currently a corrective trend, but it is anticipated to conclude soon, transitioning into an upward trend. If this transition occurs, a 4-5 day upward trend is expected, with the possibility of additional gains after a weakening in the correction trend. The fact that the trend is progressing within the Bullish zone implies an overall positive momentum. Presently, during upward movements, the high price shows an average increase of about 6%, while the closing price reflects an average increase of approximately 4%, ind

RIOT Platforms: Analyzing Weekly Trends and Forecasting Market Movements.

Image
Introduction: The RIOT Platforms weekly trend has been in a bearish zone for the past 10 weeks, indicating a strong selling sentiment and weak buying pressure. However, the current week shows a gradual increase in buying strength, leading to a successful reversal and potential uptrend. Weekly Trend Analysis: The recent weeks have displayed a consistent downtrend, but the strengthening buying pressure in the current week suggests a possible turnaround. This upward momentum is anticipated to continue for the next 3-4 weeks. Considering this weekly trend, a positive uptick can be expected in the daily charts as well. Short-Term Outlook: The rebound trend is expected to persist until mid-November, with an estimated increase of approximately 30% during this period. However, it is crucial to note that by the end of November, the weekly trend is likely to revert to a downtrend, indicating limited gains and strong downward pressure. Medium to Long-Term Strategy: The exact starting point of

Popular Posts

NASDAQ. The current analysis suggests that the NASDAQ index is currently in a bearish trend, with a recommendation to sell and observe..

TSLA. On May 15, 2024, TSLA stock closed at 174.0, marking a decrease of 2.01%. The current trend zone is Bearish, suggesting a suitable investment position of Sell and Observe.

NASDAQ. The document provides a detailed market analysis suggesting a bullish trend for the NASDAQ index, recommending a 'Buy and Hold' strategy for both long-term and short-term investments.

DowJones. The current analysis suggests that the Dow Jones index is in a bearish trend, recommending a strategy of selling and observing for long-term investment.

SOXL. Navigating the Bearish Zone: Strategies for Short-Term Trading in a Volatile Market.

= Pretiming Premium =

AMC Entertainment Holdings Daily Stock Analysis: Potential Reversal in Trend.

S&P500. Comprehensive Analysis and Strategies for S&P 500 Investment.

SMTC. Investors should take note of the bearish trend in SMTC stock, currently in a 'Sell and Observe' phase for the long-term strategy.

MARA. The current trend appears to be 'Downtrend and The trend is progressing in the Bearish zone. The characteristics of the trend are: Continuous decline (standby) - (High selling pressure).