Posts

SPY Forecast: Insight into Bearish Trends and Prospects for Upcoming Bullish Surge.

Image
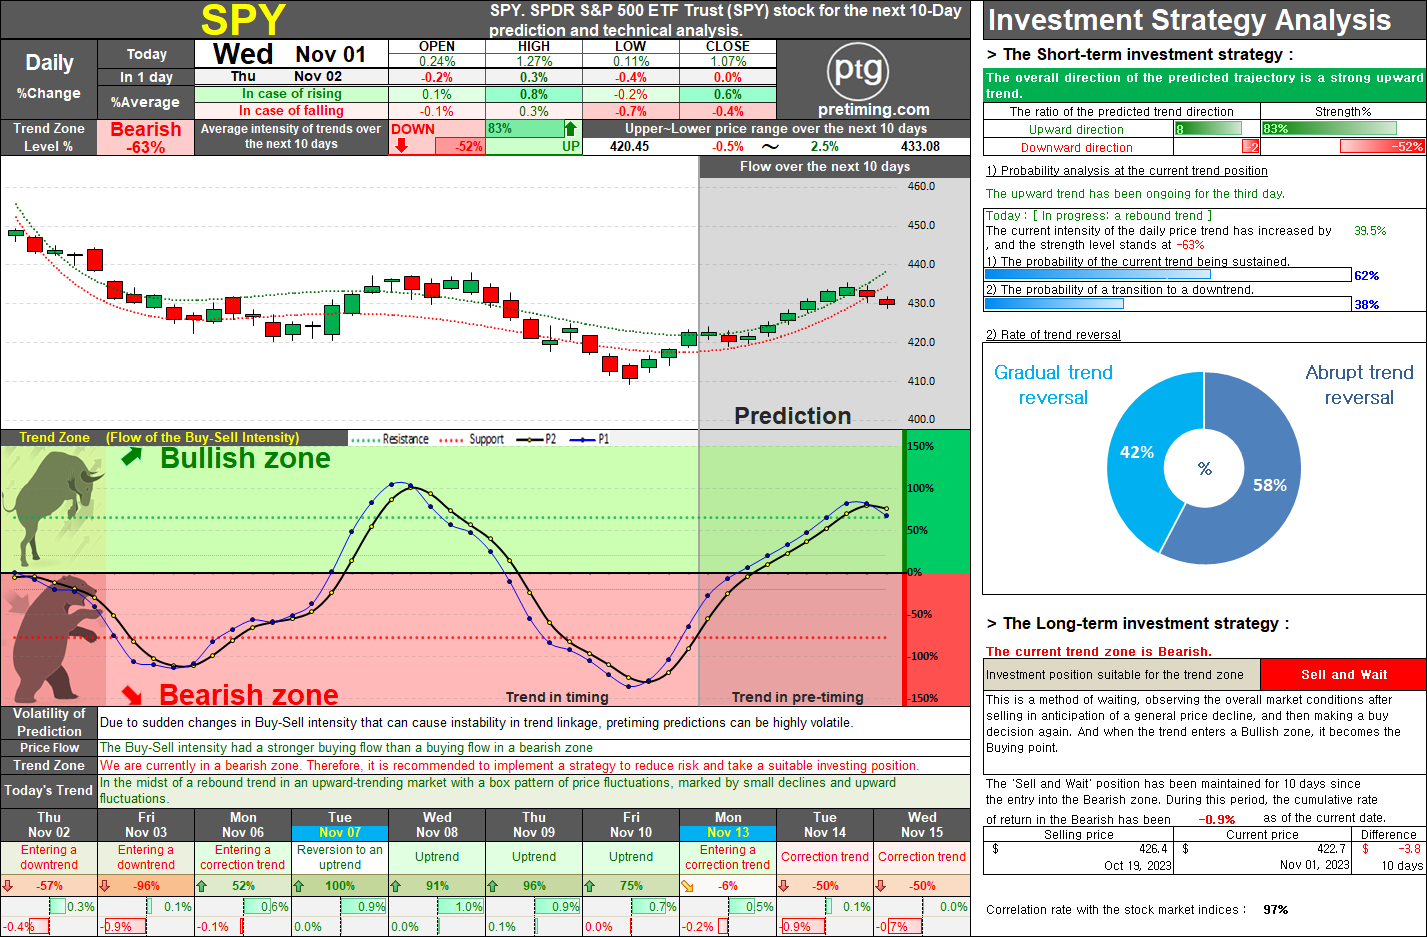
SPY: Daily Price Analysis Over the past 10 days, the SPDR S&P 500 ETF Trust (SPY) entered a Bearish zone, displaying a downtrend and subsequent rebound pattern. The recent three-day trend indicates a promising upward movement. In Bearish zones, rebound trends signify a temporary weakening of selling pressure and a temporary strengthening of buying interest. This rebound pattern seems to have reached a short-term peak, indicating an imminent consolidation phase. Considering the current position within the Bearish zone, it appears that buying interest might weaken, and selling pressure could intensify, potentially leading to a re-entry into the downtrend. This scenario is expected to unfold over the next 2-3 days, within the predicted range and timeframe. If this downward trend doesn't transition back into a Bearish zone and instead enters the Bullish zone, a bullish trend is anticipated to commence from the following week. During this upward phase, buying interest is likely to s

Navigating UPST: Analyzing Current Trends and Future Projections.

Image
  UPST (Upstart Holdings) Daily Price Analysis: The daily price trend of Upstart Holdings has been showing a reversal pattern since four days ago, starting from the bearish zone. A reversal pattern from the bearish zone indicates a temporary weakening of selling pressure and a temporary strengthening of buying pressure. The trend observed four days prior to the start of the reversal pattern displayed a weakening selling pressure, with buying pressure yet to strengthen, resulting in a mild downtrend in the bearish zone. This marked the entry point into the reversal pattern. Subsequently, the buying pressure gradually increased, indicating the current upward momentum. It is important to note that in a reversal pattern, the upward movement is limited, and even if there is an increase, it is likely to be temporary. This pattern is characteristic of the bearish zone, where there is a strong potential for selling sentiment. The current reversal pattern, with diminishing buying pressure since

Popular Posts

NASDAQ. The current analysis suggests that the NASDAQ index is currently in a bearish trend, with a recommendation to sell and observe..

TSLA. On May 15, 2024, TSLA stock closed at 174.0, marking a decrease of 2.01%. The current trend zone is Bearish, suggesting a suitable investment position of Sell and Observe.

NASDAQ. The document provides a detailed market analysis suggesting a bullish trend for the NASDAQ index, recommending a 'Buy and Hold' strategy for both long-term and short-term investments.

DowJones. The current analysis suggests that the Dow Jones index is in a bearish trend, recommending a strategy of selling and observing for long-term investment.

SOXL. Navigating the Bearish Zone: Strategies for Short-Term Trading in a Volatile Market.

= Pretiming Premium =

AMC Entertainment Holdings Daily Stock Analysis: Potential Reversal in Trend.

S&P500. Comprehensive Analysis and Strategies for S&P 500 Investment.

SMTC. Investors should take note of the bearish trend in SMTC stock, currently in a 'Sell and Observe' phase for the long-term strategy.

MARA. The current trend appears to be 'Downtrend and The trend is progressing in the Bearish zone. The characteristics of the trend are: Continuous decline (standby) - (High selling pressure).