Posts

Market Insights: Evaluating Nasdaq's Unexpected Bullish Turn and Potential Correction.

Image
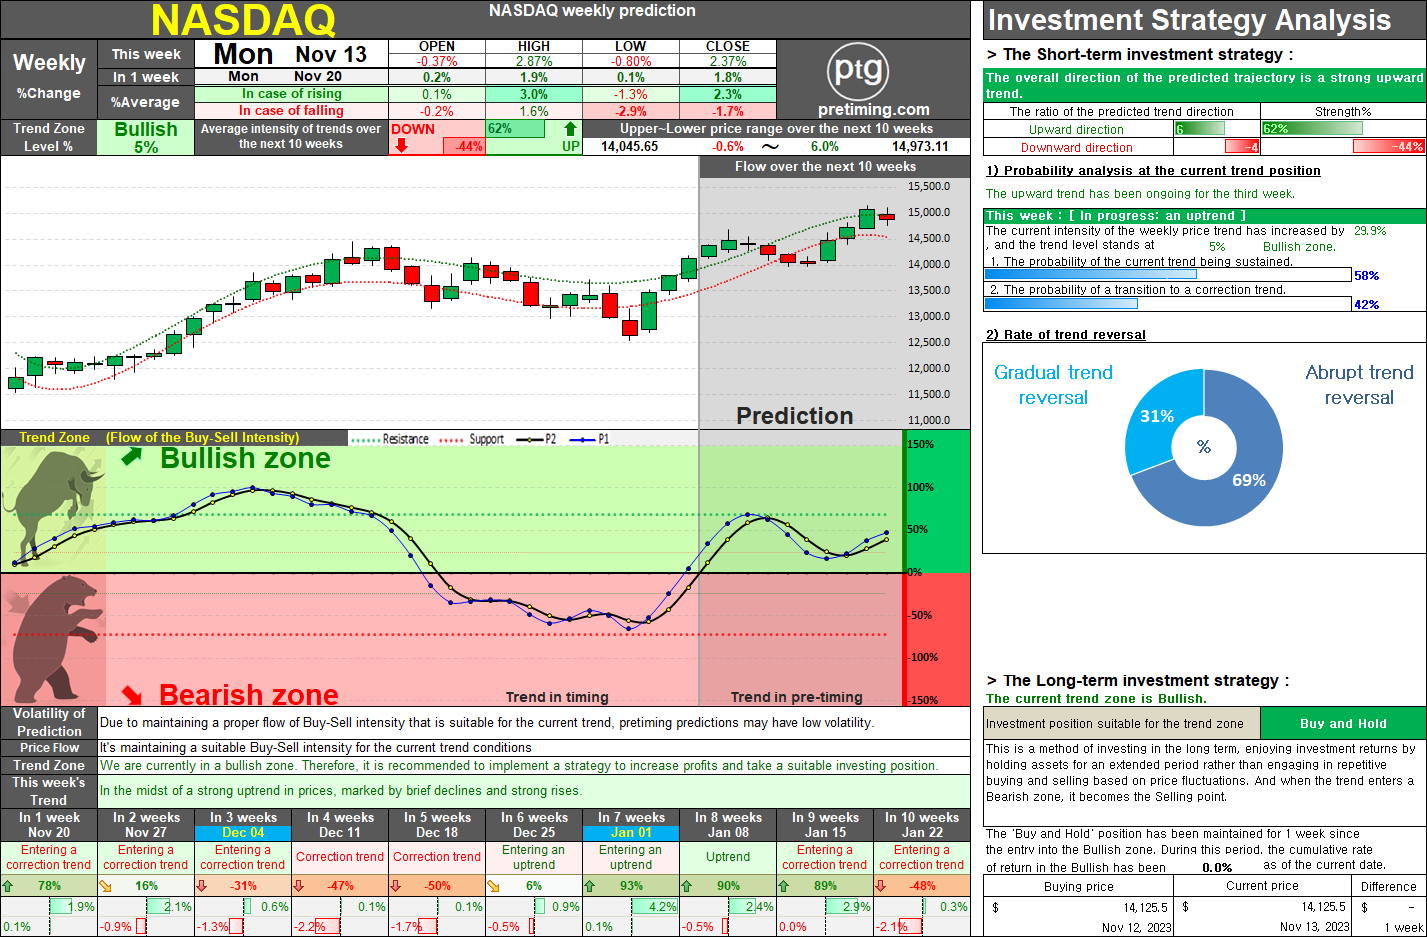
The Nasdaq index has experienced a strong upward trend and a rebound trajectory this week, leading to the current state where the weekly trend has entered the Bullish zone. It is anticipated that the weekly trend will continue within the Bullish zone for the foreseeable future. Moreover, the previously consistent prediction of a downward trend entering from mid-November, characterized by a weakening buying strength and strengthening selling pressure, is expected to undergo some modifications. While it is challenging to determine whether this week's trend is a temporary strong upward movement, based on the volatility observed this week, there is a possibility that the gradual trend with mild buying strength may persist for another 1-2 weeks. However, as it appears to be a point where a peak is forming and the trend has entered the Bullish zone instead of the predicted downward trend, a transition to a correction trend is anticipated. If next week shows a marginal or limited upward m

XOM Daily Stock Analysis: Navigating Through Bearish Trends and Anticipating Reversals.

Image
XOM. Exxon Mobil Corporation (XOM) stock for the next 10-Day prediction and technical analysis. In this report, we delve into the recent performance of Exxon Mobil Corporation (XOM) and analyze its daily stock trends, providing insights into potential future trajectories. Oscillating Trends: XOM's daily stock prices have been oscillating between bearish and bullish zones, indicating a recurring pattern of downward and upward trends. Despite a recent three-day upward trend, signs suggest that this rebound may be short-lived. As of November 16th, we anticipate a resumption of the downward trend, with a bearish phase likely to persist for the foreseeable future. Anticipated Market Shifts: Following this expected decline, there is a potential reversal on the horizon, likely manifesting in the early part of the following week. However, it is crucial to note that the daily trend has been entrenched in the bearish zone for the past 16 days, and even with a temporary rebound, an extend

Popular Posts

SMTC. Investors should take note of the bearish trend in SMTC stock, currently in a 'Sell and Observe' phase for the long-term strategy.

= Pretiming Premium =

DowJones. The current analysis suggests that the Dow Jones index is in a bearish trend, recommending a strategy of selling and observing for long-term investment.

NASDAQ. The current analysis suggests that the NASDAQ index is currently in a bearish trend, with a recommendation to sell and observe.

AAPL. The weekly trend for AAPL appears to be in a bearish zone, with a downward trajectory underway. However, there are indications of a short-term entry into a rebound trend.

SOXL. Navigating the Bearish Zone: Strategies for Short-Term Trading in a Volatile Market.

NASDAQ. Navigating Market Dynamics: Analyzing Bearish Trends and Strategic Rebound Approaches

MARA. The current trend appears to be 'Downtrend and The trend is progressing in the Bearish zone. The characteristics of the trend are: Continuous decline (standby) - (High selling pressure).

S&P500. Comprehensive Analysis and Strategies for S&P 500 Investment.

LABU. Short-Term Strategy : Timing Selling and Buying Amidst Bearish Trends