Posts

GME (GameStop) Daily Price Analysis.

Image
Summary: The daily price of GameStop has been in the Bearish zone for 29 consecutive days, with a cumulative decline of -15.7% since entering the Bearish zone based on the closing price at the entry point. Within the Bearish zone, the stock trend can be divided into 'downward trend' and 'rebound trend,' with a noticeable presence of potential selling sentiment. As of November 27th, a shift from the recent rebound trend to a stronger downward trend has been observed, and it is anticipated that this downward trend will continue for the next 2-3 days. Future Outlook: Following this period of increased selling intensity, a rebound trend is expected to resume once selling pressure subsides. However, it is anticipated that the overall bearish trend will persist as buying strength weakens again, and selling intensity strengthens. Given its 68% correlation with the broader U.S. market, fluctuations in the predicted trend may occur based on the overall market sentiment. Despite

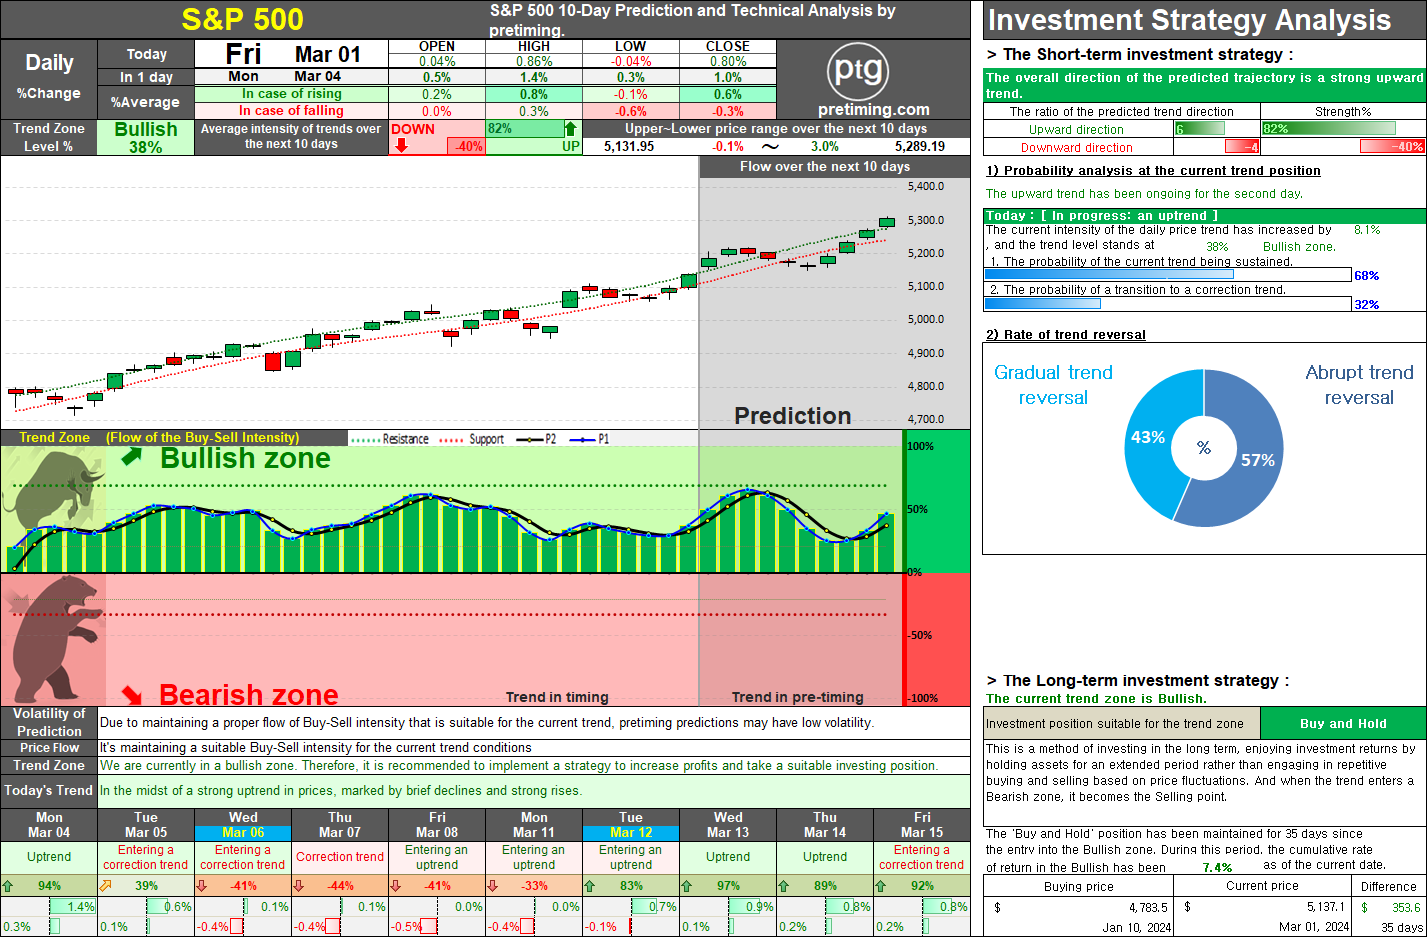
S&P 500 : The S&P 500 index has entered the Bullish zone this week, maintaining an upward trend.

Image
The S&P 500 index has entered the Bullish zone this week, maintaining an upward trend. The current state has transitioned from a rebound trend to an uptrend, as mentioned last week. However, a trend is gradually emerging, indicating a correction trend with a weakening buying momentum, as mentioned in the past week. With this trend likely to continue for a while, temporary strong upward and downward fluctuations are anticipated. It is projected that a transition to a correction trend will occur around the focal point of the next 1-2 weeks. Until early November, the likelihood of entering the Bullish zone seemed low, and from mid-November, a strong downward trend was expected to resume. However, considering the final trend that unfolded until last week in mid-November, it is confirmed that inflation is easing with the release of CPI and PPI indicators. The market sentiment is spreading with expectations of a halt in interest rate hikes and anticipation of a decrease. As a result, the

Popular Posts

SMTC. Investors should take note of the bearish trend in SMTC stock, currently in a 'Sell and Observe' phase for the long-term strategy.

= Pretiming Premium =

DowJones. The current analysis suggests that the Dow Jones index is in a bearish trend, recommending a strategy of selling and observing for long-term investment.

NASDAQ. The current analysis suggests that the NASDAQ index is currently in a bearish trend, with a recommendation to sell and observe.

AAPL. The weekly trend for AAPL appears to be in a bearish zone, with a downward trajectory underway. However, there are indications of a short-term entry into a rebound trend.

SOXL. Navigating the Bearish Zone: Strategies for Short-Term Trading in a Volatile Market.

NASDAQ. Navigating Market Dynamics: Analyzing Bearish Trends and Strategic Rebound Approaches

MARA. The current trend appears to be 'Downtrend and The trend is progressing in the Bearish zone. The characteristics of the trend are: Continuous decline (standby) - (High selling pressure).

S&P500. Comprehensive Analysis and Strategies for S&P 500 Investment.

LABU. Short-Term Strategy : Timing Selling and Buying Amidst Bearish Trends