Posts

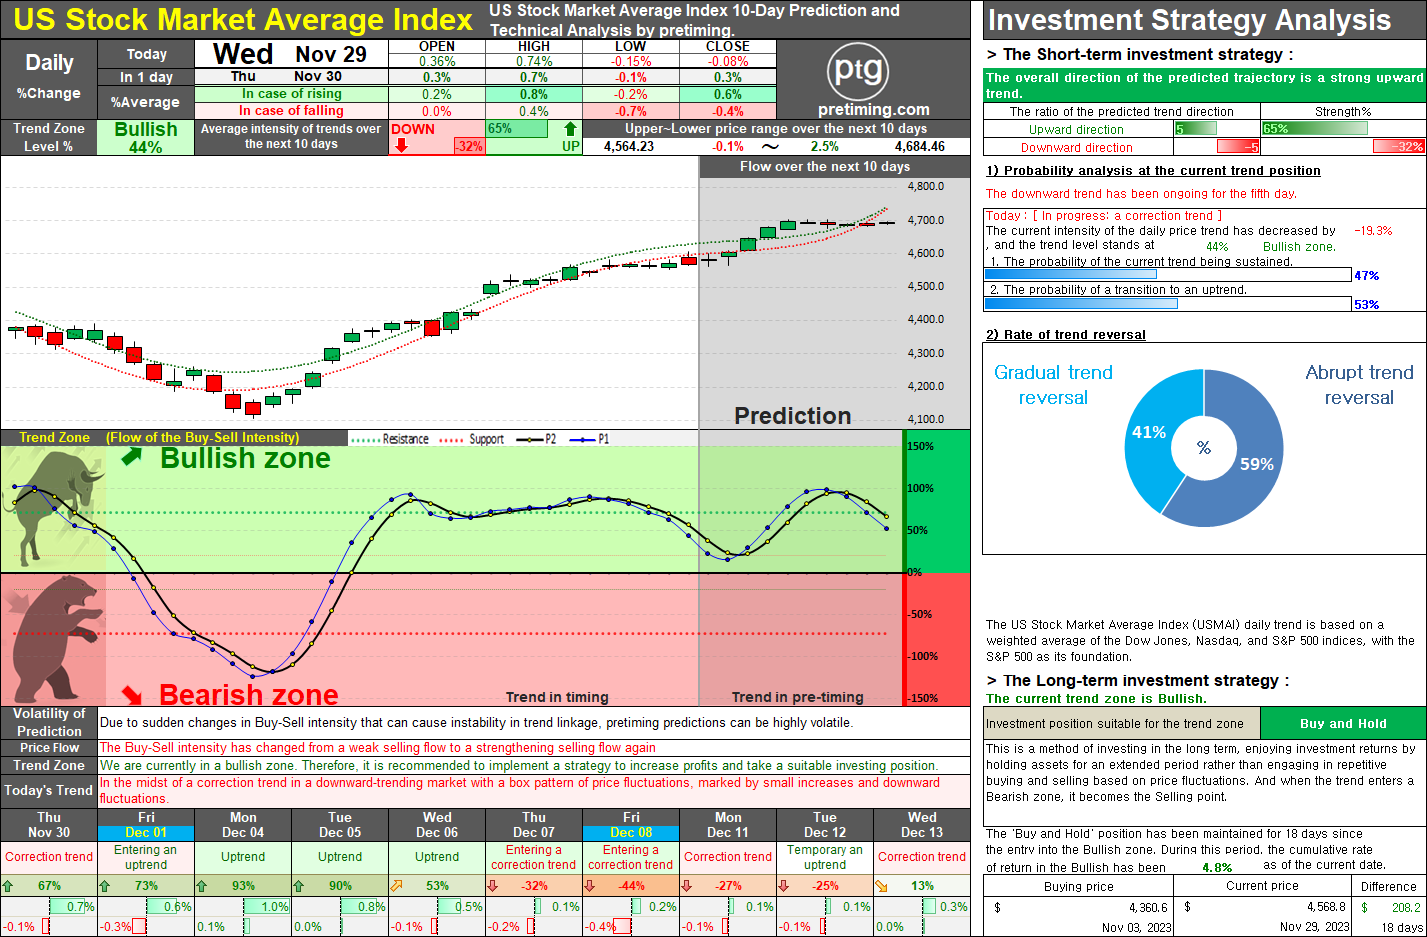
Analyzing the Daily Momentum: U.S. Stock Market Poised to Return to Bullish Territory.

Image
The daily trend of the U.S. stock market's average index indicates a momentum towards entering an upward trend today, and it is expected to soon transition back into an uptrend. However, even in the event of a shift to an upward trend, it is anticipated that after a brief period of advancement, the overall projected trajectory will experience a corrective trend, starting from early next week. Nov 30, 2023 ◆ Closed price 4,591.10 0.49%     ◆ Appropriate Investment Position: Bullish-Buy [Long-term strategy] ◆ Today's Buy-Sell intensity analysis The current trend appears to be 'Entering an uptrend'. The OPEN-price started with a suitable upward rate for the current trend and The HIGH and LOW prices are showing an appropriate HIGH-price to the current trend and a stronger LOW-price Finally, the CLOSE-price closed with a suitable upward rate for the current trend. The overall buy-and-sell intensity indicates that the buy intensity is stronger than the sell. Assuming

Market Analysis: Challenges in Sustaining Recent Upward Trend.

Image
The daily trend of the US stock market average index had shown signs of entering an upward trend from the previous day, and on November 29th, today, it exhibited a promising upward momentum, transitioning into an uptrend. However, it failed to sustain the upward momentum during the trading session, with buying strength weakening, leading to a closing in a slightly consolidating manner. Despite this current state, the overall outlook suggests a reversion to a corrective trend, yet it is anticipated that the market will soon display a renewed inclination towards an upward trend. Nov 29, 2023 ◆ Closed price 4,568.80 -0.08%     ◆ Appropriate Investment Position: Bullish-Buy [Long-term strategy] ◆ Today's Buy-Sell intensity analysis The current trend appears to be 'Correction trend'. The OPEN-price started with a stronger upward rate than the current trend and The HIGH and LOW prices are showing a stronger HIGH-price and a weaker LOW-price Finally, the CLOSE-price closed wi

Popular Posts

NASDAQ. The current analysis suggests that the NASDAQ index is currently in a bearish trend, with a recommendation to sell and observe..

TSLA. On May 15, 2024, TSLA stock closed at 174.0, marking a decrease of 2.01%. The current trend zone is Bearish, suggesting a suitable investment position of Sell and Observe.

= Pretiming Premium =

NASDAQ. The document provides a detailed market analysis suggesting a bullish trend for the NASDAQ index, recommending a 'Buy and Hold' strategy for both long-term and short-term investments.

DowJones. The current analysis suggests that the Dow Jones index is in a bearish trend, recommending a strategy of selling and observing for long-term investment.

SOXL. Navigating the Bearish Zone: Strategies for Short-Term Trading in a Volatile Market.

AMC Entertainment Holdings Daily Stock Analysis: Potential Reversal in Trend.

S&P500. Comprehensive Analysis and Strategies for S&P 500 Investment.

MARA. The current trend appears to be 'Downtrend and The trend is progressing in the Bearish zone. The characteristics of the trend are: Continuous decline (standby) - (High selling pressure).

SMTC. Investors should take note of the bearish trend in SMTC stock, currently in a 'Sell and Observe' phase for the long-term strategy.