Posts

USMAI: Weekly US Market Composite Index: Navigating the Current Correction Trend and Future Projections for 2024.

Image
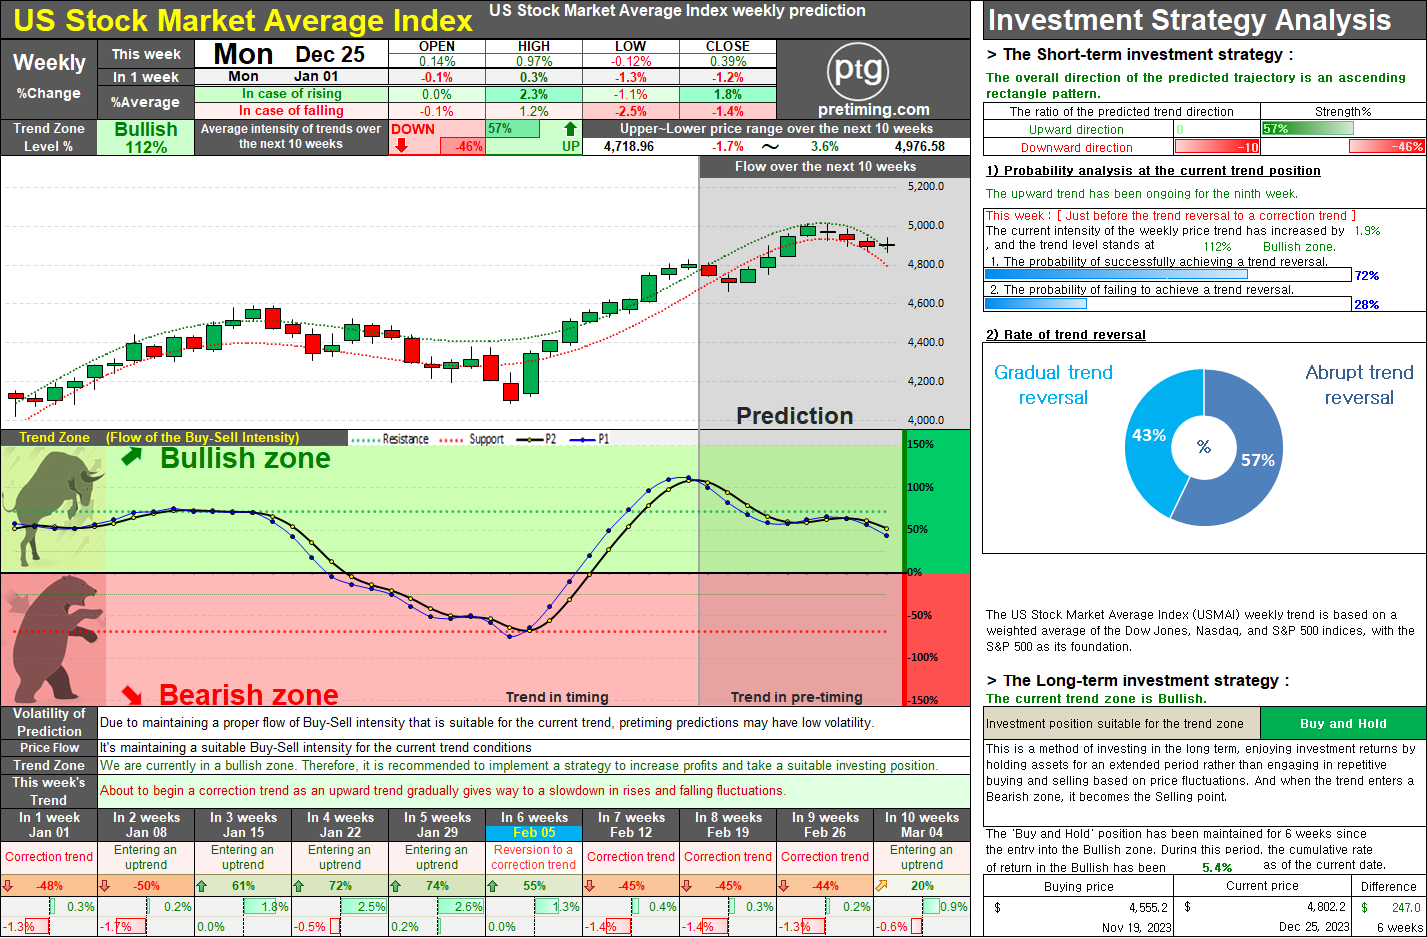
This week, the weekly trend of the US Market Composite Index (USMAI) appears to be showing signs of entering a correction trend. It is likely to undergo a transition to a correction trend soon, and a correction trend is anticipated over the next 2 to 3 weeks. Following this, around mid to late January, there seems to be a trend indicating a transition back to an upward trend. However, this is expected to be a brief phase, and afterwards, a strengthening selling pressure is likely to emerge, indicating an overall increase in selling intensity. The currently predicted target of a 5000-point increase is subject to a high likelihood of change, and even if reached, there is a very high probability that it will be a temporary peak. In February, the possibility of entering the Bearish zone is gradually increasing. Looking at the overall trend of 2024 divided into the first and second halves, the first half seems to exhibit a generally bearish trend, while as we approach the second half, the b

USMAI. Daily Trends: Anticipating a Shift from Bullish to Correctional Momentum.

Image
  The daily trend of USMAI is currently progressing in the Bullish zone, but as of December 20th, there is an anticipation of a shift towards a correction trend where buying strength is expected to weaken. In the short term, fluctuations within a sideways trend are expected. It is foreseen that the buying intensity may gradually diminish, and there is a likelihood of a temporary shift in favor of selling strength over the next 2-3 weeks. Given this projected correctional flow, the robust upward trend expected in the current daily trend prediction is likely to be adjusted, and there is a possibility of the daily trend temporarily entering the Bearish zone around the end of December to early January. Dec 19, 2023 ◆ Closed price 4,808.60 0.64%     ◆ Appropriate Investment Position: Bullish-Buy [Long-term strategy] ◆ Today's Buy-Sell intensity analysis The current trend appears to be 'Uptrend'. The OPEN-price started with a weaker upward rate than the current trend and The H

Popular Posts

NASDAQ. The current analysis suggests that the NASDAQ index is currently in a bearish trend, with a recommendation to sell and observe..

TSLA. On May 15, 2024, TSLA stock closed at 174.0, marking a decrease of 2.01%. The current trend zone is Bearish, suggesting a suitable investment position of Sell and Observe.

NASDAQ. The document provides a detailed market analysis suggesting a bullish trend for the NASDAQ index, recommending a 'Buy and Hold' strategy for both long-term and short-term investments.

DowJones. The current analysis suggests that the Dow Jones index is in a bearish trend, recommending a strategy of selling and observing for long-term investment.

SOXL. Navigating the Bearish Zone: Strategies for Short-Term Trading in a Volatile Market.

= Pretiming Premium =

AMC Entertainment Holdings Daily Stock Analysis: Potential Reversal in Trend.

S&P500. Comprehensive Analysis and Strategies for S&P 500 Investment.

SMTC. Investors should take note of the bearish trend in SMTC stock, currently in a 'Sell and Observe' phase for the long-term strategy.

MARA. The current trend appears to be 'Downtrend and The trend is progressing in the Bearish zone. The characteristics of the trend are: Continuous decline (standby) - (High selling pressure).