Posts

S&P 500. Insights into S&P 500 Trends and Potential Shifts.

Image
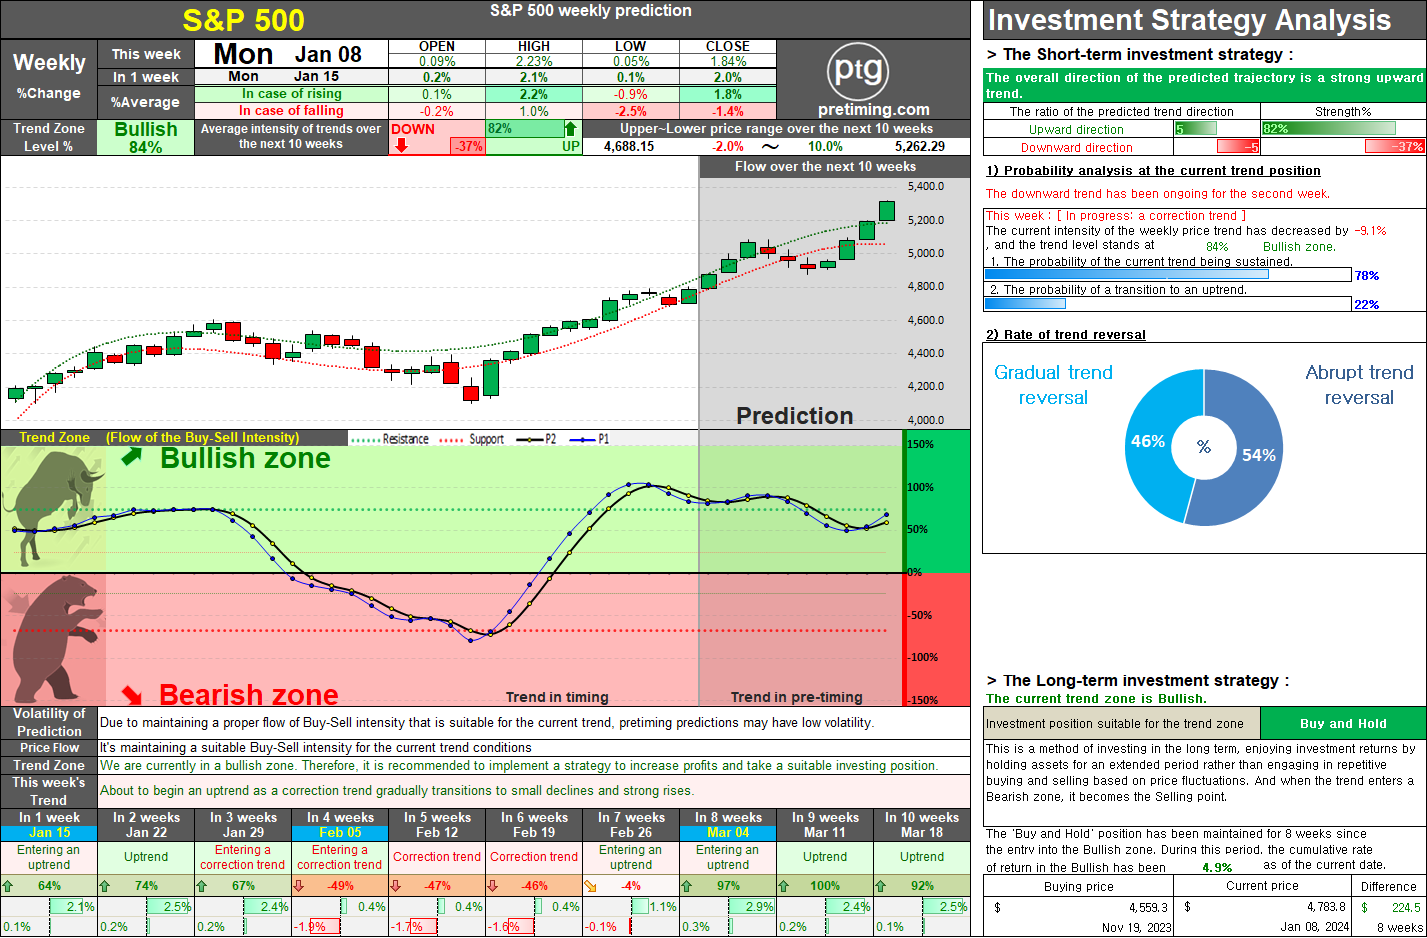
  The weekly trend of the S&P 500 index is currently undergoing a correction in the Bullish zone. This week, there is a visible strengthening of buying momentum during the correction trend, indicating a potential re-entry into the upward trend. This trend is expected to continue into the following week. Until the end of January, a strong buying momentum is anticipated, but as we move into February, the buying strength is expected to wane, leading to the emergence of a correction trend. Starting from February, there are signs that selling pressure will gradually intensify, raising the likelihood of entering the Bearish zone. Jan 08, 2024 ◆ Closed price 4,783.83 1.84%     ◆ Appropriate Investment Position: Bullish-Buy [Long-term strategy] ◆ Thisweek's Buy-Sell intensity analysis The current trend appears to be 'Entering an uptrend'. The OPEN-price started with a stronger upward rate than the current trend and The HIGH and LOW prices are showing an appropriate HIGH-pri

S&P 500. Potential Shift in S&P 500 Trends: Navigating the Possibility of a Correction

Image
  The daily S&P 500 index has entered a bullish zone today, displaying a favorable upward trend. However, as of January 11th, there is a high likelihood of a shift towards a corrective trend. Given the significance of today's release of Consumer Price Index (CPI) and inflation indicators, the point at which the correction trend intensifies, there is a possibility of re-entering the bearish zone. If selling pressure strengthens, we could see a return to the bearish zone. Conversely, if the released indicators align with consensus expectations, we might observe a gradual entry into a correction trend or the continuation of the upward trend. Jan 10, 2024 ◆ Closed price 4,783.45 0.57%     ◆ Appropriate Investment Position: Bullish-Buy [Long-term strategy] ◆ Today's Buy-Sell intensity analysis The current trend appears to be 'Uptrend'. The OPEN-price started with a weaker upward rate than the current trend and The HIGH and LOW prices are showing an appropriate HIGH-p

Popular Posts

SMTC. Investors should take note of the bearish trend in SMTC stock, currently in a 'Sell and Observe' phase for the long-term strategy.

= Pretiming Premium =

DowJones. The current analysis suggests that the Dow Jones index is in a bearish trend, recommending a strategy of selling and observing for long-term investment.

NASDAQ. The current analysis suggests that the NASDAQ index is currently in a bearish trend, with a recommendation to sell and observe.

AAPL. The weekly trend for AAPL appears to be in a bearish zone, with a downward trajectory underway. However, there are indications of a short-term entry into a rebound trend.

SOXL. Navigating the Bearish Zone: Strategies for Short-Term Trading in a Volatile Market.

NASDAQ. Navigating Market Dynamics: Analyzing Bearish Trends and Strategic Rebound Approaches

MARA. The current trend appears to be 'Downtrend and The trend is progressing in the Bearish zone. The characteristics of the trend are: Continuous decline (standby) - (High selling pressure).

S&P500. Comprehensive Analysis and Strategies for S&P 500 Investment.

LABU. Short-Term Strategy : Timing Selling and Buying Amidst Bearish Trends