Posts

Showing posts with the label NASDAQ

NASDAQ. Index Short-term Strategy and Trend Prediction by pretiming analysis.

Image
  This analysis delves into the short-term strategy and trend prediction for the NASDAQ index, highlighting the current bearish zone and recommending suitable investment positions. The strategy emphasizes active selling responses to mitigate risks during downturns, while providing insights into optimal buying and selling timings. Key points include forecasts on price ranges, trend reversals, and buy-sell intensity. Through pretiming analysis, this report aims to guide investors in navigating market fluctuations and making informed decisions. Mar 15, 2024       NASDAQ closing price 15,973.2 -0.96%             ◆ [Long-term strategy] The current trend zone is Bearish. and Investment position suitable for the trend zone is Sell and Wait.         The trend within a Bearish zone is divided into a 'Downtrend' in the downward direction and a 'Rebound Trend' in the upward direction. In the Downtrend, there is a strong do

NASDAQ. On a long-term strategy perspective, the current trend zone is identified as an uptrend, and a buy-and-hold strategy is recommended.

Image
  On a long-term strategy perspective, the current trend zone is identified as an uptrend, and a buy-and-hold strategy is recommended. The uptrend zone is divided into an 'Uptrend' and a 'Correction Trend'. Within the uptrend, there is a strong upward momentum with occasional downward movements. Additionally, while the short-term outlook suggests ongoing upward movement, a correction trend is anticipated to commence soon, prompting specified buying and selling timings. Currently, the upward trend is being sustained with a strong likelihood of significant upward movement within the next 10 days. Consequently, maintaining the current 'buy (bullish)' and 'hold' position is advised, with a suggested optimal buying timing forecasted for 2 days later. Mar 04, 2024       NASDAQ closing price 16,207.5 -0.41%             ◆ [Long-term strategy] The current trend zone is Bullish. and Investment position suitable for the trend

Popular Posts

NASDAQ. The current analysis suggests that the NASDAQ index is currently in a bearish trend, with a recommendation to sell and observe..

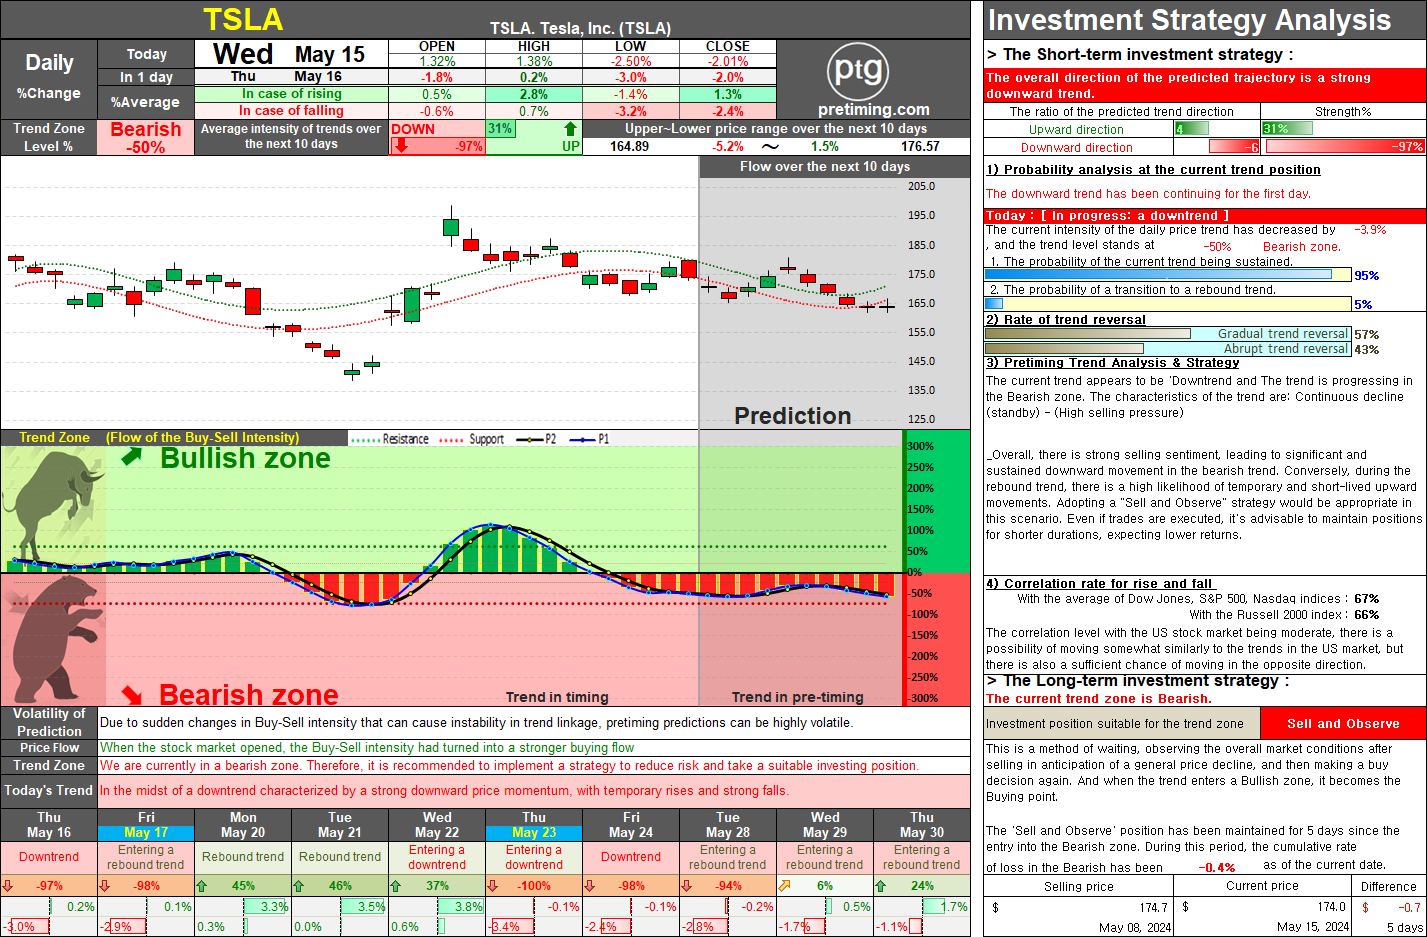
TSLA. On May 15, 2024, TSLA stock closed at 174.0, marking a decrease of 2.01%. The current trend zone is Bearish, suggesting a suitable investment position of Sell and Observe.

= Pretiming Premium =

NASDAQ. The document provides a detailed market analysis suggesting a bullish trend for the NASDAQ index, recommending a 'Buy and Hold' strategy for both long-term and short-term investments.

DowJones. The current analysis suggests that the Dow Jones index is in a bearish trend, recommending a strategy of selling and observing for long-term investment.

SOXL. Navigating the Bearish Zone: Strategies for Short-Term Trading in a Volatile Market.

AMC Entertainment Holdings Daily Stock Analysis: Potential Reversal in Trend.

S&P500. Comprehensive Analysis and Strategies for S&P 500 Investment.

MARA. The current trend appears to be 'Downtrend and The trend is progressing in the Bearish zone. The characteristics of the trend are: Continuous decline (standby) - (High selling pressure).

SMTC. Investors should take note of the bearish trend in SMTC stock, currently in a 'Sell and Observe' phase for the long-term strategy.