Posts

Showing posts with the label SOXL

Analysis and Outlook for SOXL: Direxion Daily Semiconductor Bull 3X ETF.

Image
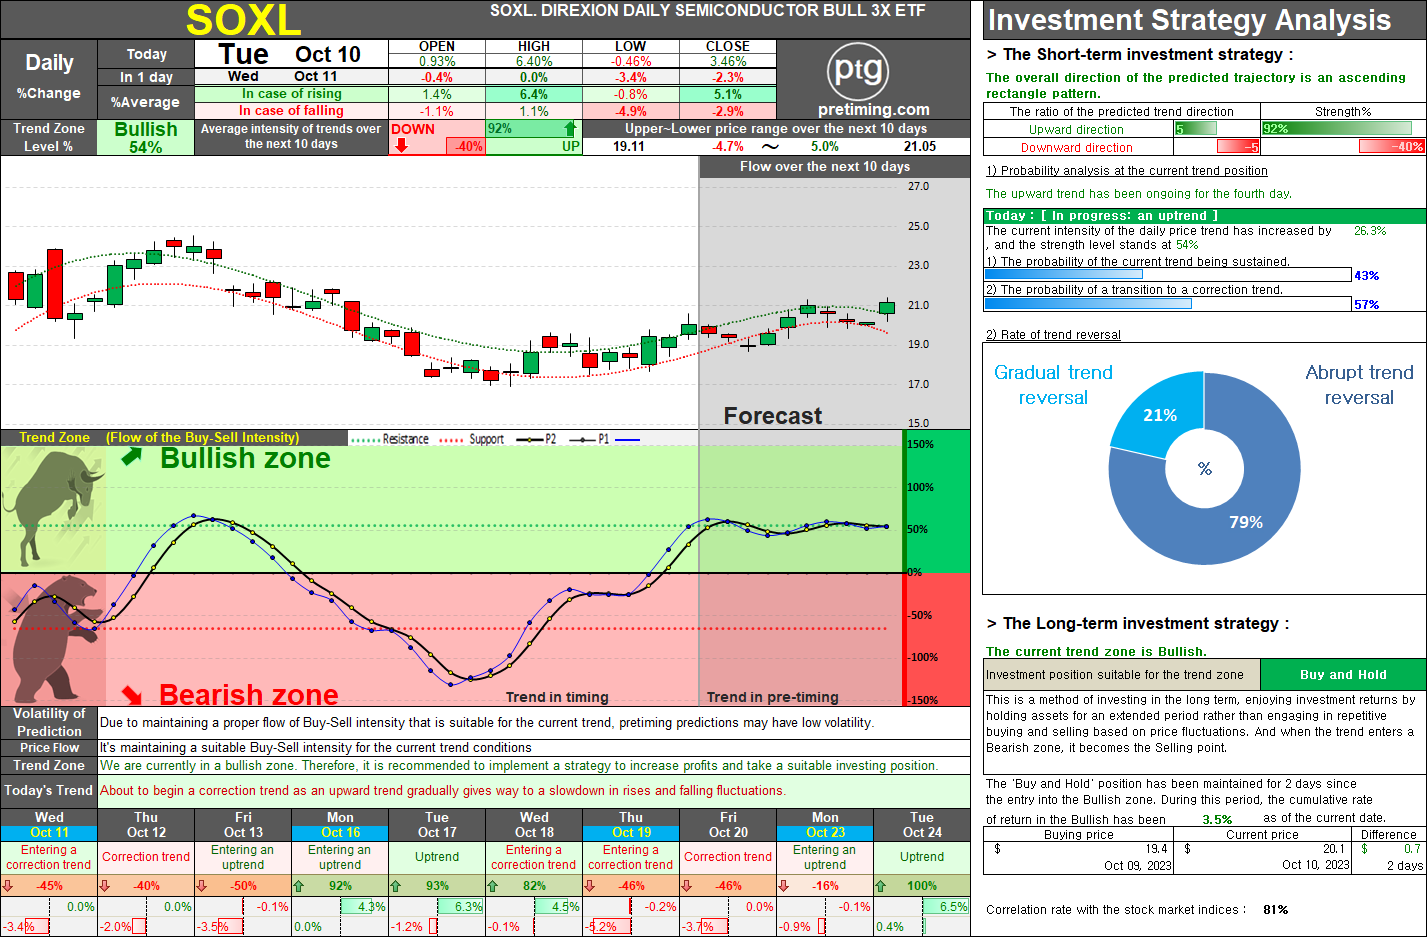
Analysis and Outlook for SOXL: Direxion Daily Semiconductor Bull 3X ETF. Introduction: The current daily trend for the Direxion Daily Semiconductor Bull 3X ETF (SOXL) indicates a bullish phase, with upward momentum in progress. However, there are signs of weakening buying strength, leading to a temporary shift in sentiment toward selling pressure. This report explores the short-term fluctuations expected over the next 1-2 days, anticipating a mix of declines and rebounds. A key turning point is anticipated in the coming week, as the daily trend shows signs of resuming its upward trajectory. Short-Term Analysis: In the short term, a brief period of volatility characterized by fluctuations is expected. This is attributed to a temporary decrease in buying intensity, resulting in heightened selling pressure. Investors should be prepared for a nuanced market with potential ups and downs over the next 1-2 days. Long-Term Outlook: The overall daily trend is anticipated to re-enter a bullish p

SOXL ETF: Navigating Short-Term Volatility in Semiconductor Markets

Image
SOXL: DIREXION DAILY SEMICONDUCTOR BULL 3X ETF has entered the Bullish zone three days ago, indicating an ongoing uptrend. However, it is currently entering a corrective phase marked by limited short-term gains and fluctuations. A brief correction period of approximately three days is expected. Following this, a strong upward trend is likely to resume, potentially starting either this Friday or early next week. Nevertheless, as the uptrend progresses into next week, creating new peaks, the daily price movements are anticipated to become increasingly limited and temporary. By mid-October, the daily price trend is expected to enter the Bearish zone, characterized by significant and sharp declines, as the amplitude of both upward and downward movements widens. Oct 10, 2023 ◆ Closed price 20.05 3.46%     ◆ Appropriate Investment Position: Bullish-Buy [Long-term strategy] ◆ Today's stock price Buy-Sell intensity analysis The current trend appears to be 'Entering a correction trend

Popular Posts

NASDAQ. The current analysis suggests that the NASDAQ index is currently in a bearish trend, with a recommendation to sell and observe..

= Pretiming Premium =

DowJones. The current analysis suggests that the Dow Jones index is in a bearish trend, recommending a strategy of selling and observing for long-term investment.

SOXL. Navigating the Bearish Zone: Strategies for Short-Term Trading in a Volatile Market.

TSLA. On May 15, 2024, TSLA stock closed at 174.0, marking a decrease of 2.01%. The current trend zone is Bearish, suggesting a suitable investment position of Sell and Observe.

NASDAQ. The document provides a detailed market analysis suggesting a bullish trend for the NASDAQ index, recommending a 'Buy and Hold' strategy for both long-term and short-term investments.

S&P500. Comprehensive Analysis and Strategies for S&P 500 Investment.

MARA. The current trend appears to be 'Downtrend and The trend is progressing in the Bearish zone. The characteristics of the trend are: Continuous decline (standby) - (High selling pressure).

SMTC. Investors should take note of the bearish trend in SMTC stock, currently in a 'Sell and Observe' phase for the long-term strategy.

AMC Entertainment Holdings Daily Stock Analysis: Potential Reversal in Trend.