Posts

Showing posts with the label TSLA

TSLA Daily Trend Analysis: Potential Shifts in Bullish to Bearish Zones Dec 11, 2023

Image
The current status indicates a potential transition from the Bullish zone to the Bearish zone, with the daily trend experiencing downward pressure. There is a high likelihood of the stock entering a downward trend if the current position leads to a decline. However, should a downward trend emerge, it is anticipated to be temporary in the short term. There is a likelihood of an upward trend manifesting around the beginning of next week. Looking at the medium to long-term perspective, the probability of entering a Bearish zone is high. Even in the event of a subsequent upward trend, there is an expectation that buying strength will gradually weaken over time, making sustained bullish trends less likely. Instead, a more restrained, oscillating pattern with limited upward and downward movements is anticipated. Given the stock's correlation of approximately 71% with the broader U.S. market, it is important to note that trends and timing may change based on overall market movements. The

TSLA Stock Analysis: Assessing Short-term Bearish Trends and Potential Rebound Strategies.

Image
  TSLA Daily Stock Analysis: Navigating Short-term Downtrends and Assessing Rebound Potential. Summary: Tesla, Inc.'s daily stock performance has been in a bearish zone for the past nine days, exhibiting a downtrend followed by a rebound trend. On October 30th, the stock clearly showed a downtrend, especially evident from the low being 6.09% below the average low fluctuation of -3.4%. This indicates a strong selling pressure. In the short term, this downtrend is expected to continue for another two days. However, there are signs of weakening selling pressure, suggesting a potential rebound trend starting around Wednesday or Thursday this week. Even in a rebound scenario, the buying pressure remains weak, indicating a limited upward movement within the range of $185 to $200. The current daily trend is in the bearish zone, signifying a strong potential for further selling. Therefore, long-term investment strategies are not advisable at this point. A suitable entry point could be cons

Popular Posts

= Pretiming Premium =

SOXL. Navigating the Bearish Zone: Strategies for Short-Term Trading in a Volatile Market.

SMTC. Investors should take note of the bearish trend in SMTC stock, currently in a 'Sell and Observe' phase for the long-term strategy.

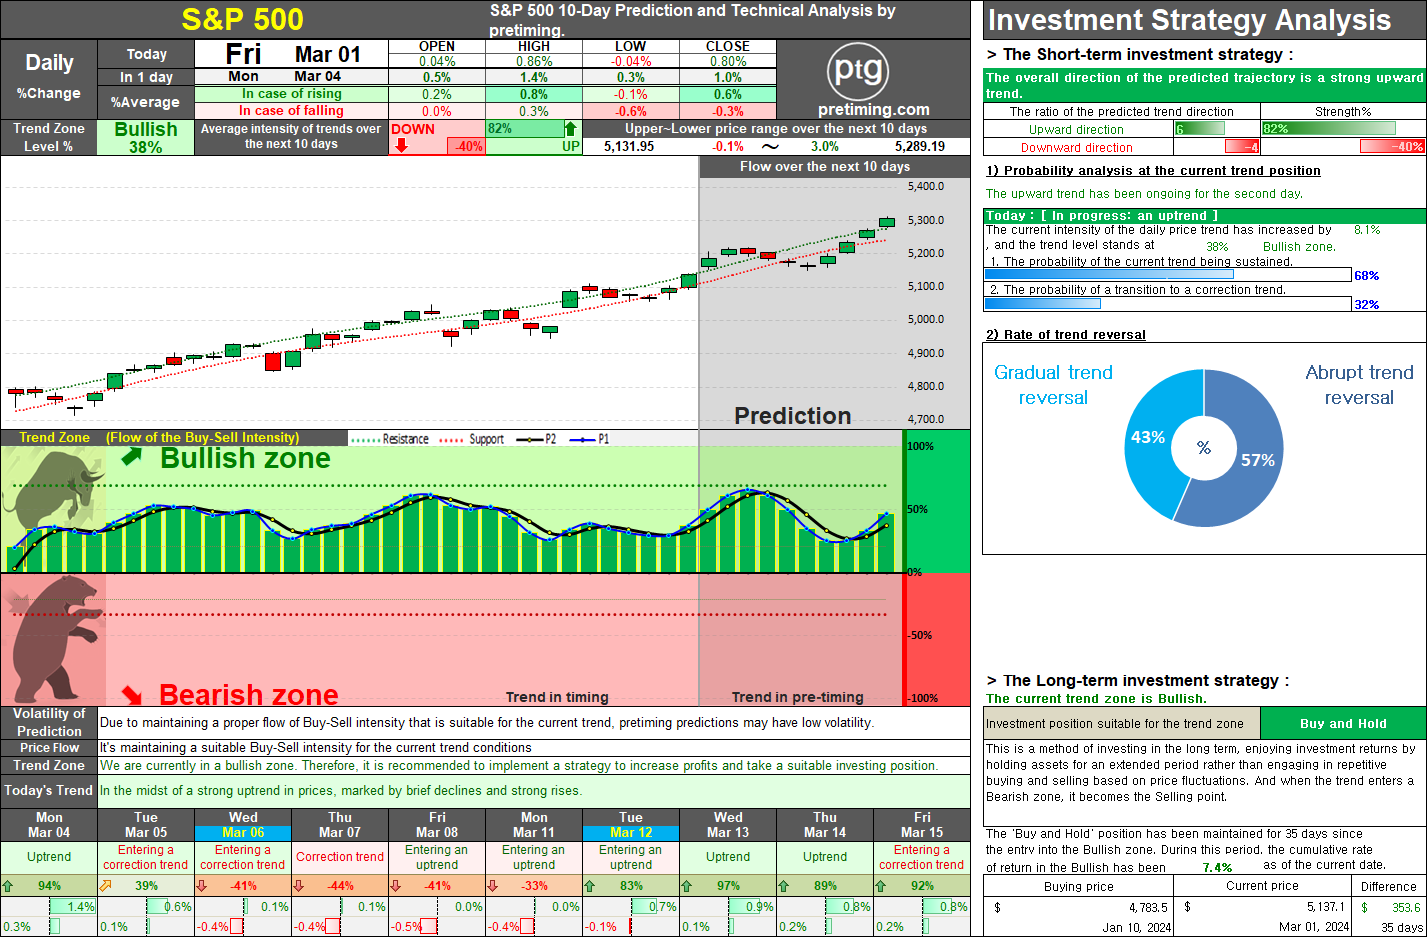
S&P 500 Investment Strategy: Navigating Bullish Trends with Buy-and-Hold and Short-Term Profit Tactics.

MARA. The current trend appears to be 'Downtrend and The trend is progressing in the Bearish zone. The characteristics of the trend are: Continuous decline (standby) - (High selling pressure).

AAPL. The weekly trend for AAPL appears to be in a bearish zone, with a downward trajectory underway. However, there are indications of a short-term entry into a rebound trend.

NASDAQ. Navigating Market Dynamics: Analyzing Bearish Trends and Strategic Rebound Approaches

S&P500. Comprehensive Analysis and Strategies for S&P 500 Investment.

NVDA. Weekly trend is undergoing a 'correction entry'/'correction trend', while the daily trend is progressing within the Bullish zone, hence the potential buying strength is gradually weakening or temporarily strong.

BLNK. Currently, it's in the midst of a correction trend in a downward-trending market with a box pattern of price fluctuations, marked by small increases and downward fluctuations.