Posts

Market Insights: TQQQ Daily Price Trends and Predictions.

Image
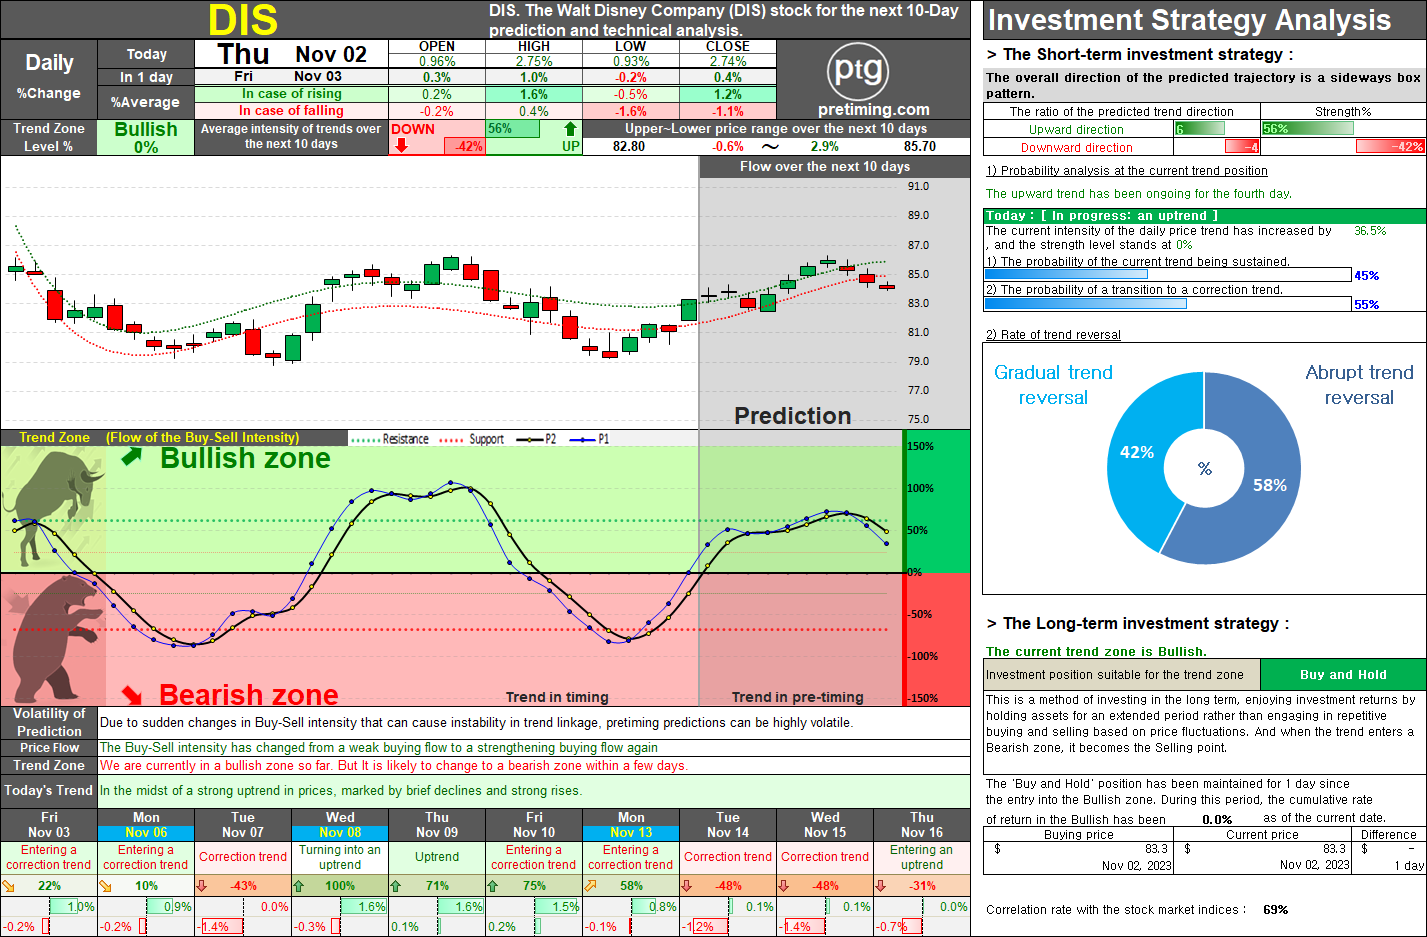
The daily stock price of TQQQ is currently in a bullish zone, indicating an ongoing uptrend. In the short term, the buying momentum is gradually weakening, suggesting a limited upward movement and the possibility of entering a correction trend. It is anticipated that a new short-term uptrend will begin, marked by a resurgence in the uptrend starting from Tuesday and Wednesday this week. Subsequently, a mild correction trend is expected to follow. The daily trend itself is progressing within the bullish zone, indicating strong potential buying strength. Overall, a positive uptrend and a subsequent correction followed by another upward movement are expected. During the uptrend, the expected intraday average high is around 3.3%, and the closing price corresponds to approximately 2.4%. Looking at the daily trend, it is anticipated that the uptrend will continue with stable support levels in the coming weeks, maintaining the bullish momentum. However, starting from the following week, the b

Analysis and Forecast of The Walt Disney Company (DIS) Daily Stock Performance.

Image
  Executive Summary: The Walt Disney Company's daily stock performance has recently entered the Bearish zone, indicating a period of decline. Over the past four days, the stock has shown signs of weakening selling pressure and temporary strengthening buying pressure, transitioning from a downtrend to a minor uptrend. As of November 2nd, the stock has entered the Bullish zone, suggesting a potential reversal in the trend. Short-Term Analysis (Next 3 Days): In the short term, it is anticipated that the stock might enter a corrective phase over the next three days, exhibiting limited and temporary fluctuations. Despite potential minor upward movements, the overall trend is expected to be subdued. However, a more significant uptrend is anticipated to resume starting from next Tuesday, with an estimated increase of approximately 4% to 5% based on the projected stock price at that time. Medium-Long Term Outlook (Next 1-2 Weeks): Looking ahead to the next 1-2 weeks, a trading range patter

Popular Posts

NASDAQ. The current analysis suggests that the NASDAQ index is currently in a bearish trend, with a recommendation to sell and observe..

TSLA. On May 15, 2024, TSLA stock closed at 174.0, marking a decrease of 2.01%. The current trend zone is Bearish, suggesting a suitable investment position of Sell and Observe.

NASDAQ. The document provides a detailed market analysis suggesting a bullish trend for the NASDAQ index, recommending a 'Buy and Hold' strategy for both long-term and short-term investments.

DowJones. The current analysis suggests that the Dow Jones index is in a bearish trend, recommending a strategy of selling and observing for long-term investment.

SOXL. Navigating the Bearish Zone: Strategies for Short-Term Trading in a Volatile Market.

= Pretiming Premium =

AMC Entertainment Holdings Daily Stock Analysis: Potential Reversal in Trend.

S&P500. Comprehensive Analysis and Strategies for S&P 500 Investment.

SMTC. Investors should take note of the bearish trend in SMTC stock, currently in a 'Sell and Observe' phase for the long-term strategy.

MARA. The current trend appears to be 'Downtrend and The trend is progressing in the Bearish zone. The characteristics of the trend are: Continuous decline (standby) - (High selling pressure).