Posts

TMF Stock Report: Analyzing Bullish Momentum and Potential Bearish Transition.

Image
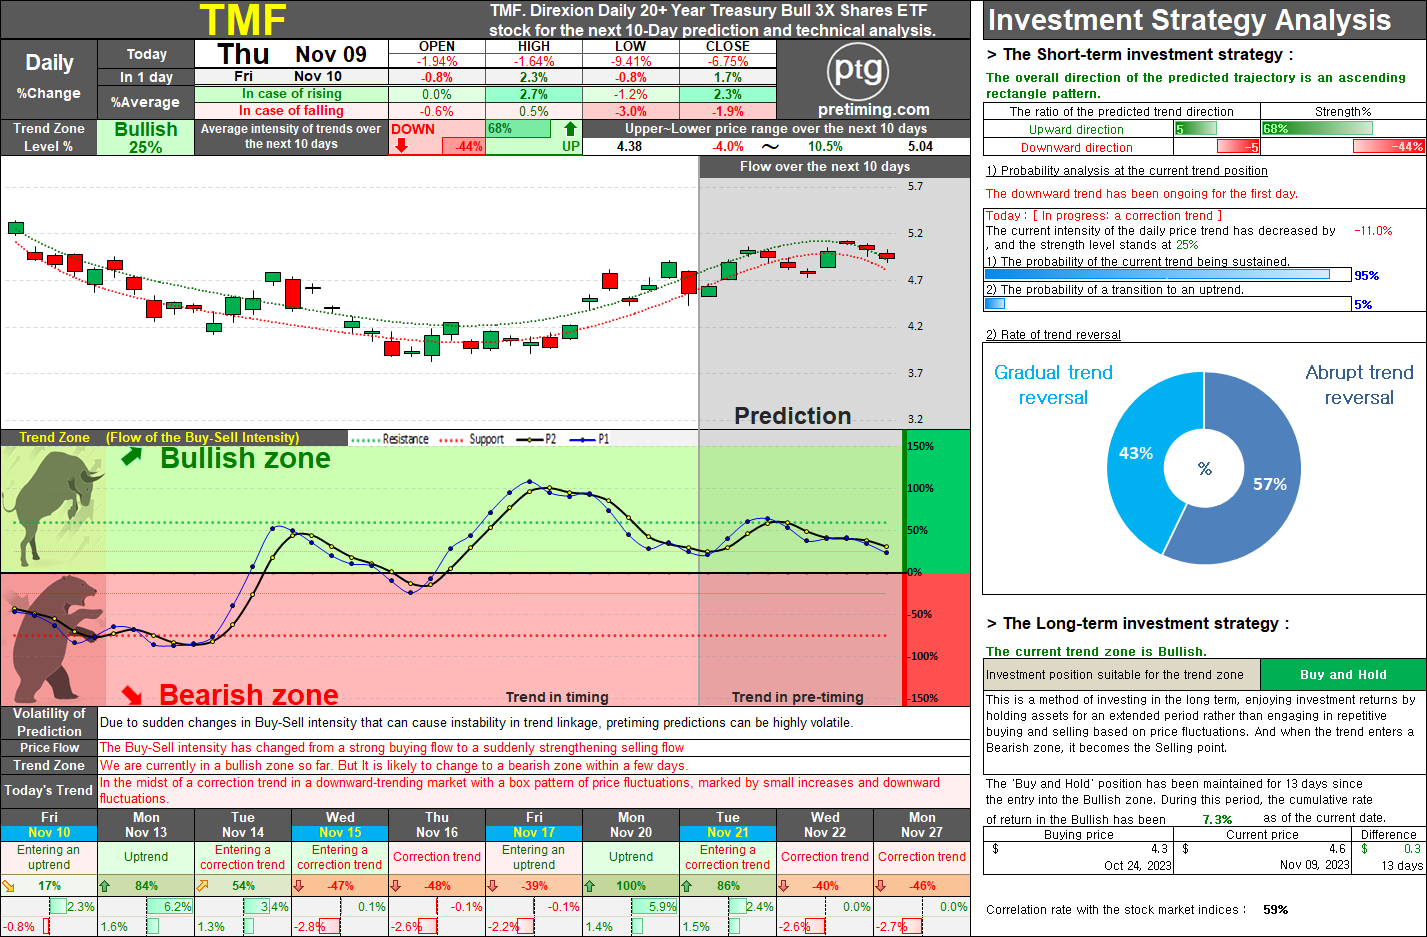
TMF. TMF. Direxion Daily 20+ Year Treasury Bull 3X Shares ETF stock for the next 10-Day prediction and technical analysis. Summary: Over the past 13 days, TMF has exhibited a bullish trend, showing a consistent upward trajectory with a cumulative increase of 7.3%. Despite multiple attempts to enter the bullish zone, the stock has encountered resistance, leading to a continuous adjustment trend within the overall bullish momentum. Recent Trends: In recent days, TMF has shown signs of attempting to enter the bullish zone, only to revert to the adjustment trend. Today, the market experienced a sudden downturn due to increased selling pressure triggered by Powell's hawkish remarks and rising bond yields. Currently, the daily trend places TMF in the bullish zone at 25%. Although there is a possibility of entering the bearish zone, short-term rebound buying may lead to another bullish trend for the next 2-3 days. Market Correlation: It is crucial to note that TMF's correlation wit

Understanding Trend Zone Analysis: A Simple Guide for Investors.

Image
1. Trend Zone Characteristic Analysis: Bullish Zone: The bullish zone represents a region where there is a strong potential for buying activity, indicating an overall robust buying strength. It encompasses both an 'uptrend' and a 'correction trend.' In the uptrend, there is a strong buying intensity leading to significant upward momentum with occasional minor downward movements. On the other hand, the correction trend indicates a weakening buying strength, resulting in limited upward movements and gentle declines or temporary downward trends. When the trend consistently remains within the bullish zone, the uptrend and correction trend alternate, creating a stair-step upward momentum. This pattern maximizes cumulative gains. Bearish Zone: The bearish zone signifies an area where there is a strong potential for selling activity, indicating a persistent selling pressure. It involves a 'downtrend' and a 'rebound trend.' In the downtrend, there is a strong

Popular Posts

NASDAQ. The current analysis suggests that the NASDAQ index is currently in a bearish trend, with a recommendation to sell and observe..

TSLA. On May 15, 2024, TSLA stock closed at 174.0, marking a decrease of 2.01%. The current trend zone is Bearish, suggesting a suitable investment position of Sell and Observe.

NASDAQ. The document provides a detailed market analysis suggesting a bullish trend for the NASDAQ index, recommending a 'Buy and Hold' strategy for both long-term and short-term investments.

= Pretiming Premium =

DowJones. The current analysis suggests that the Dow Jones index is in a bearish trend, recommending a strategy of selling and observing for long-term investment.

SOXL. Navigating the Bearish Zone: Strategies for Short-Term Trading in a Volatile Market.

AMC Entertainment Holdings Daily Stock Analysis: Potential Reversal in Trend.

S&P500. Comprehensive Analysis and Strategies for S&P 500 Investment.

MARA. The current trend appears to be 'Downtrend and The trend is progressing in the Bearish zone. The characteristics of the trend are: Continuous decline (standby) - (High selling pressure).

SMTC. Investors should take note of the bearish trend in SMTC stock, currently in a 'Sell and Observe' phase for the long-term strategy.