Posts

Navigating the Future: Analyzing CVNA Stock Trends and Projecting Market Trajectory.

Image
CVNA. Carvana Co. (CVNA) stock for the next 10-Day prediction and technical analysis. Recent Price Action: Over the past two days, CVNA has experienced a robust uptrend in its daily stock prices. Despite this short-term bullish momentum, the current positioning of the stock trend indicates a bearish sentiment, hovering around -14%. Short-Term Uptrend vs. Long-Term Bearish Outlook: While the recent surge in prices may suggest a temporary upward movement, it is crucial to recognize the prevailing bearish sentiment. The likelihood of re-entering the bullish zone seems challenging at the moment. We anticipate a weakening buying intensity coupled with strengthening selling pressure, signaling an impending downward trend. Future Price Trajectory: The overall outlook suggests a continuation of the bearish trend until the end of November, with a potential decline towards the $30 price range. The observed trend reversals indicate a 54% probability of a gradual shift and a 46% likelihood of

NASDAQ's Recent Trends: Weakening Buy Strength and Anticipating a Downward Shift.

Image
The NASDAQ daily index entered the Bullish zone seven days ago, signaling the initiation of an upward trend. However, in recent times, it has displayed a corrective trend. Since last Friday, there has been a notable surge in a robust upward momentum attempting to re-enter the bullish trend. Nevertheless, the current state of the market indicates that the buying strength is significantly weak for a complete transition into an upward trend. Additionally, looking at the projected trend, it appears challenging for the market to shift back into a bullish trend. As we approach mid-November this week, there is a noticeable weakening in buying strength compared to previous weeks, and even if a strong uptrend emerges, there is a high likelihood that it may be temporary. Overall, the prevailing condition suggests a strong selling pressure, indicating the continuation of the correction trend with a gradual increase in the magnitude of the decline. This trend is expected to persist, and there is a

Popular Posts

NASDAQ. The current analysis suggests that the NASDAQ index is currently in a bearish trend, with a recommendation to sell and observe..

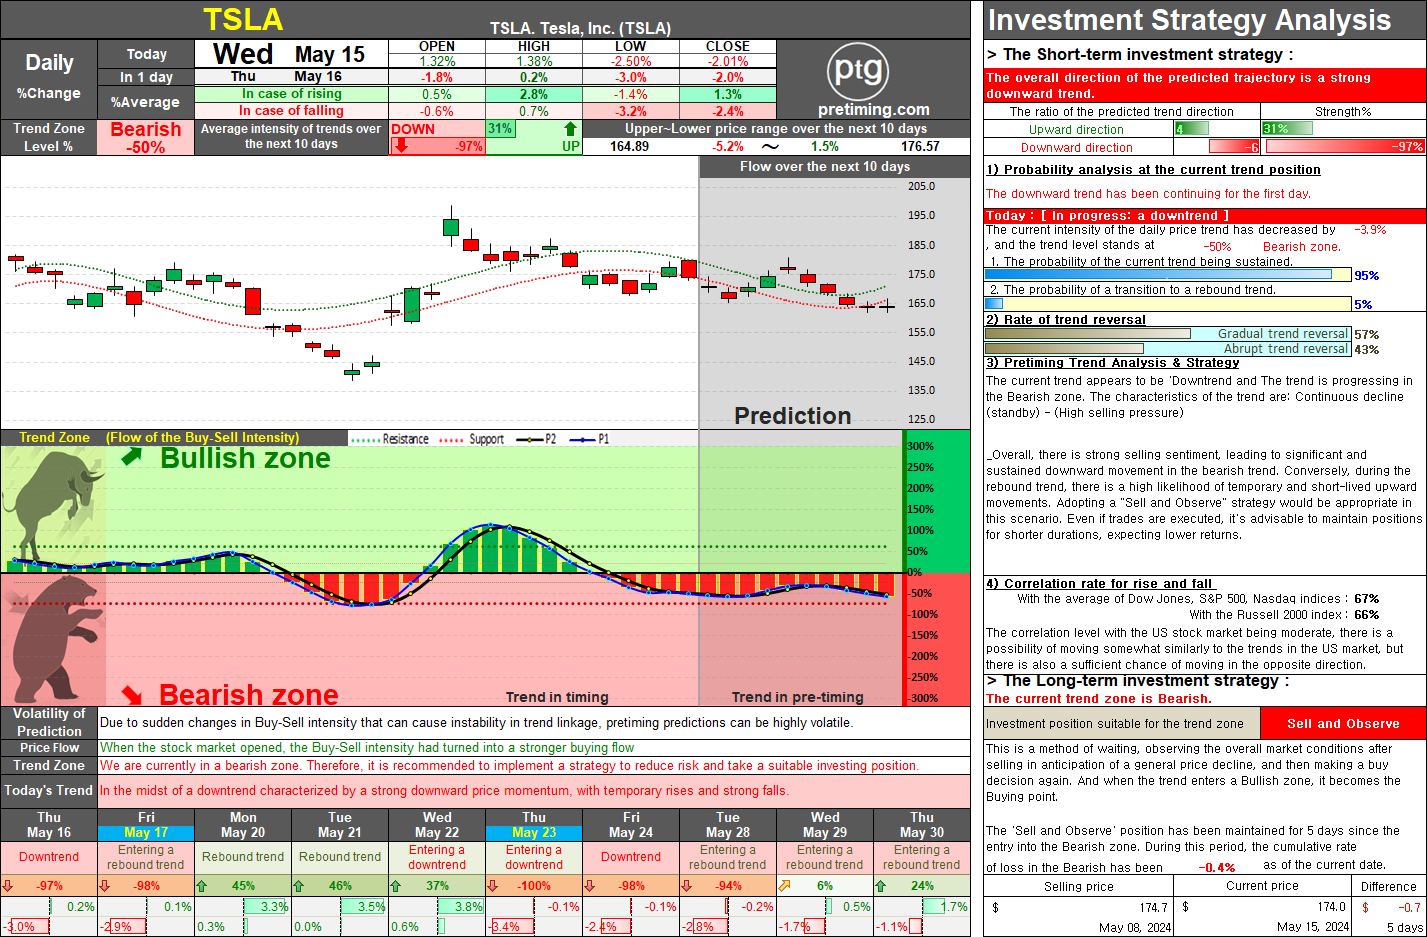
TSLA. On May 15, 2024, TSLA stock closed at 174.0, marking a decrease of 2.01%. The current trend zone is Bearish, suggesting a suitable investment position of Sell and Observe.

NASDAQ. The document provides a detailed market analysis suggesting a bullish trend for the NASDAQ index, recommending a 'Buy and Hold' strategy for both long-term and short-term investments.

DowJones. The current analysis suggests that the Dow Jones index is in a bearish trend, recommending a strategy of selling and observing for long-term investment.

SOXL. Navigating the Bearish Zone: Strategies for Short-Term Trading in a Volatile Market.

= Pretiming Premium =

AMC Entertainment Holdings Daily Stock Analysis: Potential Reversal in Trend.

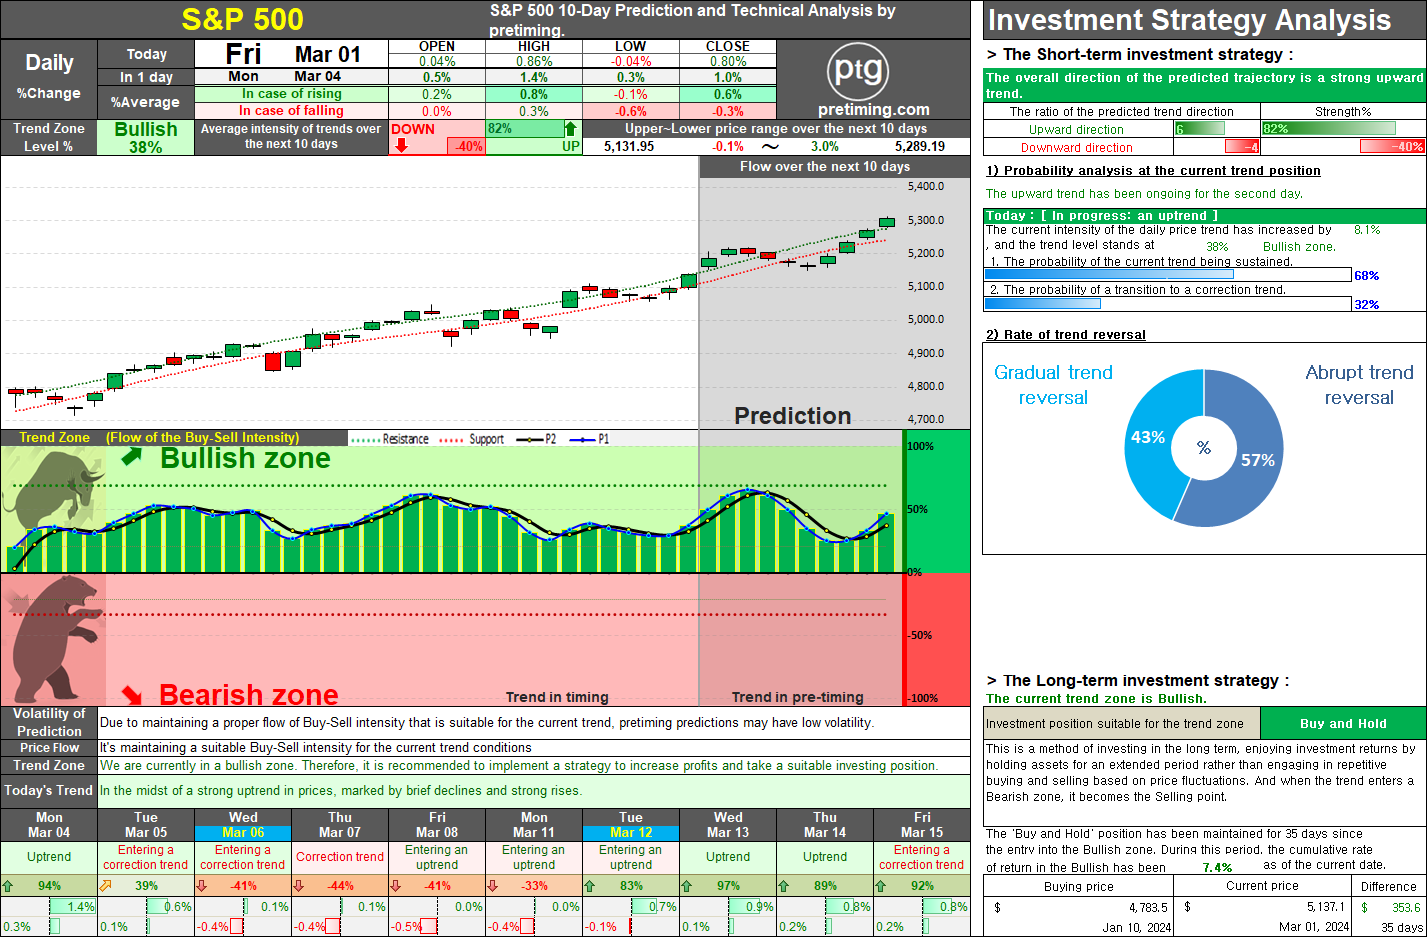
S&P500. Comprehensive Analysis and Strategies for S&P 500 Investment.

SMTC. Investors should take note of the bearish trend in SMTC stock, currently in a 'Sell and Observe' phase for the long-term strategy.

MARA. The current trend appears to be 'Downtrend and The trend is progressing in the Bearish zone. The characteristics of the trend are: Continuous decline (standby) - (High selling pressure).