Posts

S&P 500. Daily Trend Analysis: Critical Juncture Ahead

Image
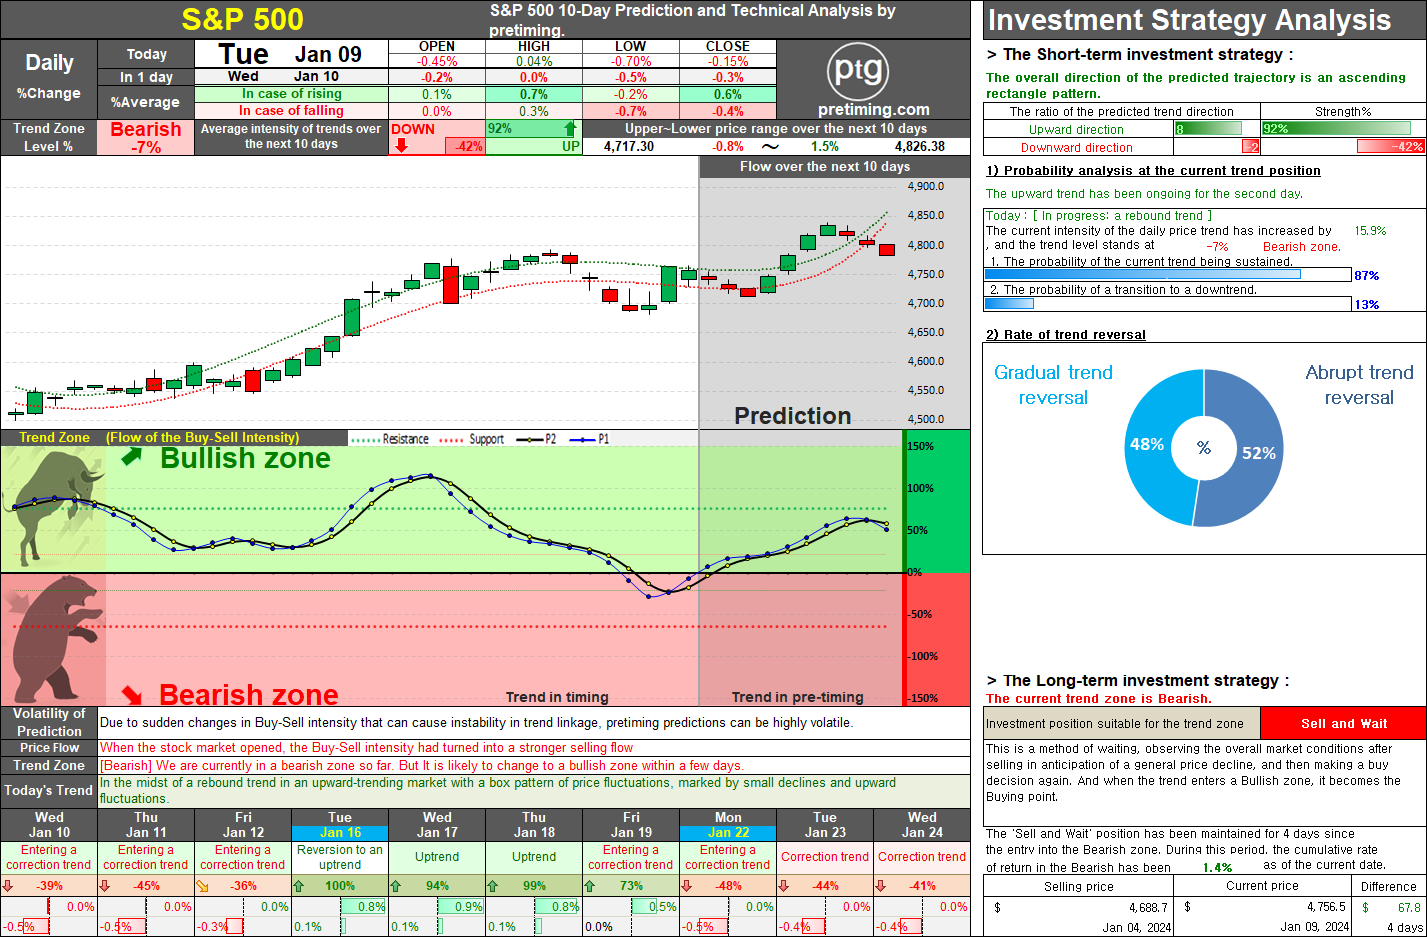
S&P 500 Daily Trend Analysis: Critical Juncture Ahead The S&P 500 entered the Bearish zone four days ago, initiating a downtrend. Currently, a rebound trend is underway. While a short-term entry into the Bullish zone is anticipated, the overall weakening of buying momentum suggests the possibility of maintaining the Bearish zone, indicating a potential continuation of the downtrend. The next 2-3 days will serve as a pivotal juncture, and the direction of buying and selling intensities during this period will likely determine the future trend. If selling pressure strengthens, maintaining the Bearish zone, there is a high likelihood of a sustained downward trend. However, if the current levels of selling and buying intensities persist, a resurgence of the upward trend from the beginning of next week in the Bullish zone is plausible. Given the numerous possibilities at this critical juncture, the flow of the next 2-3 days is of utmost importance. The directional shift in buying an

USMAI: Weekly US Market Composite Index: Navigating the Current Correction Trend and Future Projections for 2024.

Image
This week, the weekly trend of the US Market Composite Index (USMAI) appears to be showing signs of entering a correction trend. It is likely to undergo a transition to a correction trend soon, and a correction trend is anticipated over the next 2 to 3 weeks. Following this, around mid to late January, there seems to be a trend indicating a transition back to an upward trend. However, this is expected to be a brief phase, and afterwards, a strengthening selling pressure is likely to emerge, indicating an overall increase in selling intensity. The currently predicted target of a 5000-point increase is subject to a high likelihood of change, and even if reached, there is a very high probability that it will be a temporary peak. In February, the possibility of entering the Bearish zone is gradually increasing. Looking at the overall trend of 2024 divided into the first and second halves, the first half seems to exhibit a generally bearish trend, while as we approach the second half, the b

Popular Posts

NASDAQ. The current analysis suggests that the NASDAQ index is currently in a bearish trend, with a recommendation to sell and observe..

TSLA. On May 15, 2024, TSLA stock closed at 174.0, marking a decrease of 2.01%. The current trend zone is Bearish, suggesting a suitable investment position of Sell and Observe.

NASDAQ. The document provides a detailed market analysis suggesting a bullish trend for the NASDAQ index, recommending a 'Buy and Hold' strategy for both long-term and short-term investments.

= Pretiming Premium =

DowJones. The current analysis suggests that the Dow Jones index is in a bearish trend, recommending a strategy of selling and observing for long-term investment.

SOXL. Navigating the Bearish Zone: Strategies for Short-Term Trading in a Volatile Market.

AMC Entertainment Holdings Daily Stock Analysis: Potential Reversal in Trend.

S&P500. Comprehensive Analysis and Strategies for S&P 500 Investment.

MARA. The current trend appears to be 'Downtrend and The trend is progressing in the Bearish zone. The characteristics of the trend are: Continuous decline (standby) - (High selling pressure).

SMTC. Investors should take note of the bearish trend in SMTC stock, currently in a 'Sell and Observe' phase for the long-term strategy.