Posts

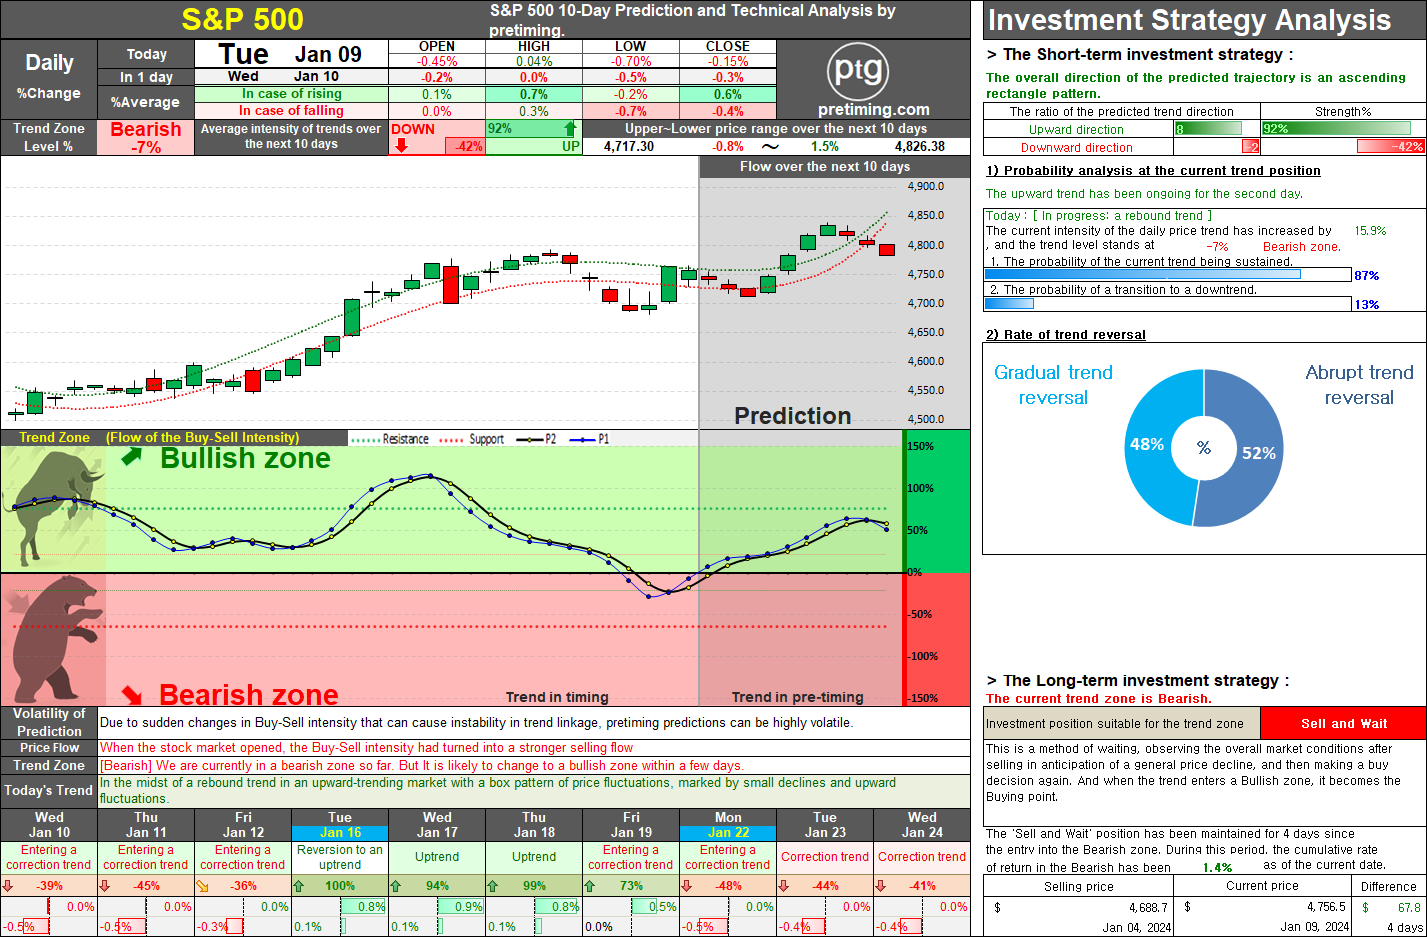
S&P 500. Potential Shift in S&P 500 Trends: Navigating the Possibility of a Correction

Image
  The daily S&P 500 index has entered a bullish zone today, displaying a favorable upward trend. However, as of January 11th, there is a high likelihood of a shift towards a corrective trend. Given the significance of today's release of Consumer Price Index (CPI) and inflation indicators, the point at which the correction trend intensifies, there is a possibility of re-entering the bearish zone. If selling pressure strengthens, we could see a return to the bearish zone. Conversely, if the released indicators align with consensus expectations, we might observe a gradual entry into a correction trend or the continuation of the upward trend. Jan 10, 2024 ◆ Closed price 4,783.45 0.57%     ◆ Appropriate Investment Position: Bullish-Buy [Long-term strategy] ◆ Today's Buy-Sell intensity analysis The current trend appears to be 'Uptrend'. The OPEN-price started with a weaker upward rate than the current trend and The HIGH and LOW prices are showing an appropriate HIGH-p

S&P 500. Daily Trend Analysis: Critical Juncture Ahead

Image
S&P 500 Daily Trend Analysis: Critical Juncture Ahead The S&P 500 entered the Bearish zone four days ago, initiating a downtrend. Currently, a rebound trend is underway. While a short-term entry into the Bullish zone is anticipated, the overall weakening of buying momentum suggests the possibility of maintaining the Bearish zone, indicating a potential continuation of the downtrend. The next 2-3 days will serve as a pivotal juncture, and the direction of buying and selling intensities during this period will likely determine the future trend. If selling pressure strengthens, maintaining the Bearish zone, there is a high likelihood of a sustained downward trend. However, if the current levels of selling and buying intensities persist, a resurgence of the upward trend from the beginning of next week in the Bullish zone is plausible. Given the numerous possibilities at this critical juncture, the flow of the next 2-3 days is of utmost importance. The directional shift in buying an

Popular Posts

SMTC. Investors should take note of the bearish trend in SMTC stock, currently in a 'Sell and Observe' phase for the long-term strategy.

= Pretiming Premium =

DowJones. The current analysis suggests that the Dow Jones index is in a bearish trend, recommending a strategy of selling and observing for long-term investment.

AAPL. The weekly trend for AAPL appears to be in a bearish zone, with a downward trajectory underway. However, there are indications of a short-term entry into a rebound trend.

NASDAQ. The current analysis suggests that the NASDAQ index is currently in a bearish trend, with a recommendation to sell and observe.

SOXL. Navigating the Bearish Zone: Strategies for Short-Term Trading in a Volatile Market.

NASDAQ. Navigating Market Dynamics: Analyzing Bearish Trends and Strategic Rebound Approaches

MARA. The current trend appears to be 'Downtrend and The trend is progressing in the Bearish zone. The characteristics of the trend are: Continuous decline (standby) - (High selling pressure).

LABU. Short-Term Strategy : Timing Selling and Buying Amidst Bearish Trends

S&P500. Comprehensive Analysis and Strategies for S&P 500 Investment.