Posts

Showing posts with the label CVNA

Navigating the Future: Analyzing CVNA Stock Trends and Projecting Market Trajectory.

Image
CVNA. Carvana Co. (CVNA) stock for the next 10-Day prediction and technical analysis. Recent Price Action: Over the past two days, CVNA has experienced a robust uptrend in its daily stock prices. Despite this short-term bullish momentum, the current positioning of the stock trend indicates a bearish sentiment, hovering around -14%. Short-Term Uptrend vs. Long-Term Bearish Outlook: While the recent surge in prices may suggest a temporary upward movement, it is crucial to recognize the prevailing bearish sentiment. The likelihood of re-entering the bullish zone seems challenging at the moment. We anticipate a weakening buying intensity coupled with strengthening selling pressure, signaling an impending downward trend. Future Price Trajectory: The overall outlook suggests a continuation of the bearish trend until the end of November, with a potential decline towards the $30 price range. The observed trend reversals indicate a 54% probability of a gradual shift and a 46% likelihood of
Carvana (CVNA) Weekly Stock Analysis

Image
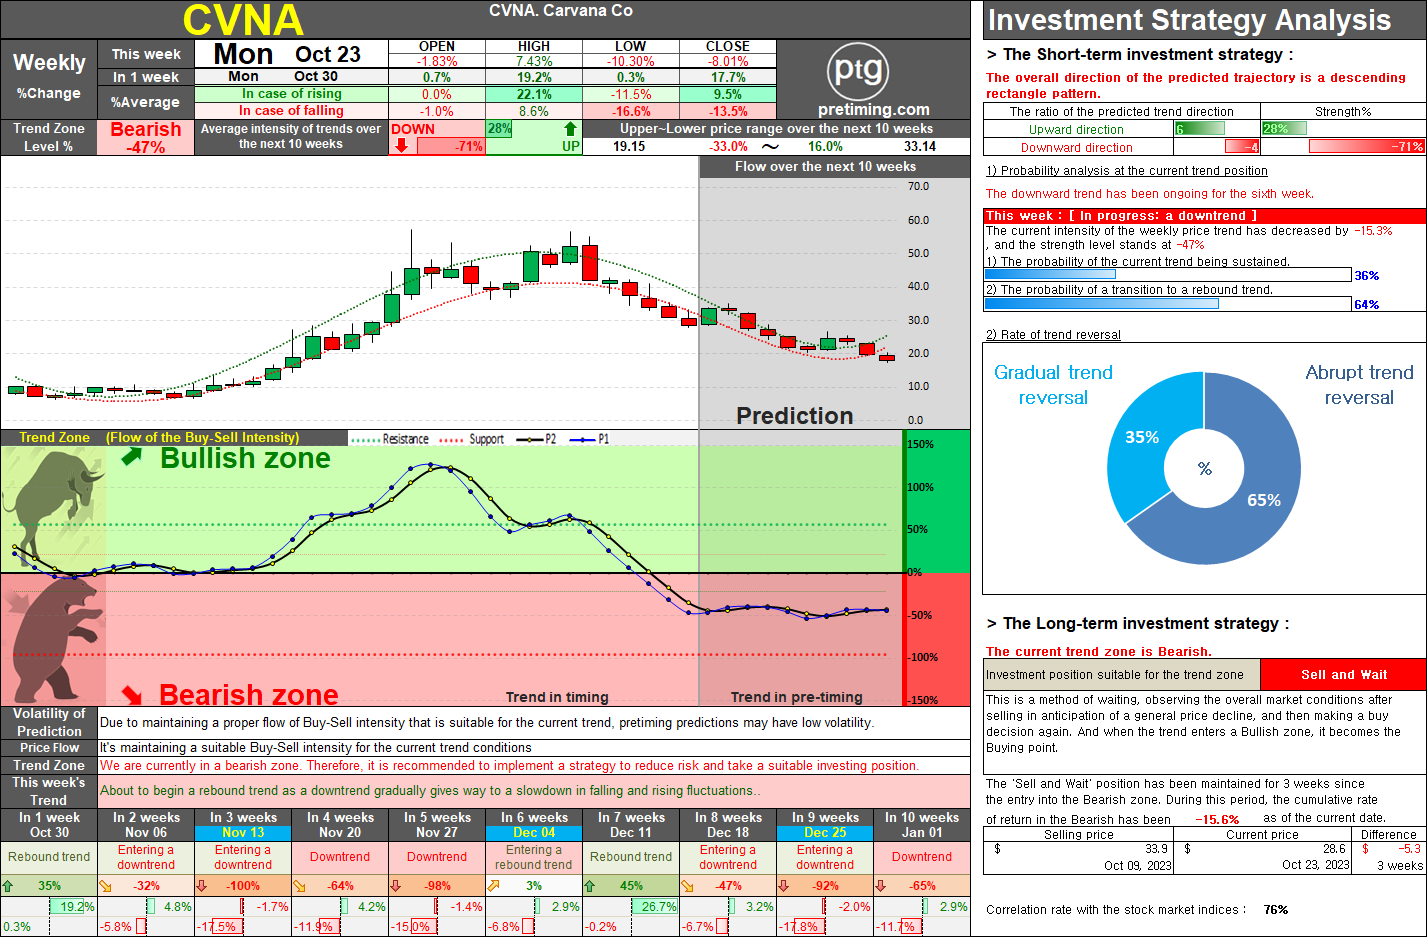
Introduction: In the past few weeks, Carvana's stock (CVNA) has been experiencing a bearish trend, transitioning from the bullish zone to the bearish zone three weeks ago. The overall market sentiment suggests a strong inclination towards selling, indicating a significant downward trend. Current Trend: As of the last week of October, the stock appears to be entering a period of minor recovery after the prolonged downward trend. Short-term indicators suggest a potential brief uptrend until mid-November. However, it is crucial to note the stock's high correlation of 76% with the overall US market, indicating that the duration of this upward trend might be influenced by the broader market conditions. Short-Term Outlook: Anticipated to last until mid-November, this short-lived uptrend may see some fluctuations based on the market's movements. It is essential for investors to be vigilant, as the stock might experience a temporary recovery, followed by a resumption of the bear

Popular Posts

SMTC. Investors should take note of the bearish trend in SMTC stock, currently in a 'Sell and Observe' phase for the long-term strategy.

= Pretiming Premium =

DowJones. The current analysis suggests that the Dow Jones index is in a bearish trend, recommending a strategy of selling and observing for long-term investment.

AAPL. The weekly trend for AAPL appears to be in a bearish zone, with a downward trajectory underway. However, there are indications of a short-term entry into a rebound trend.

NASDAQ. The current analysis suggests that the NASDAQ index is currently in a bearish trend, with a recommendation to sell and observe.

SOXL. Navigating the Bearish Zone: Strategies for Short-Term Trading in a Volatile Market.

NASDAQ. Navigating Market Dynamics: Analyzing Bearish Trends and Strategic Rebound Approaches

MARA. The current trend appears to be 'Downtrend and The trend is progressing in the Bearish zone. The characteristics of the trend are: Continuous decline (standby) - (High selling pressure).

LABU. Short-Term Strategy : Timing Selling and Buying Amidst Bearish Trends

S&P500. Comprehensive Analysis and Strategies for S&P 500 Investment.